TECHNICAL ASSET FINGERPRINT
254f4c520f7467d9d884ca58
Click to view fullscreen
Press ESC or click to close
FOUND IN PAPERS
EXPERT: healer-alpha-free VERSION 1
RUNTIME: free/openrouter/healer-alpha
INTEL_VERIFIED
## Line Charts: Llama3.1-8B-Instruct Attention Weight Analysis
### Overview
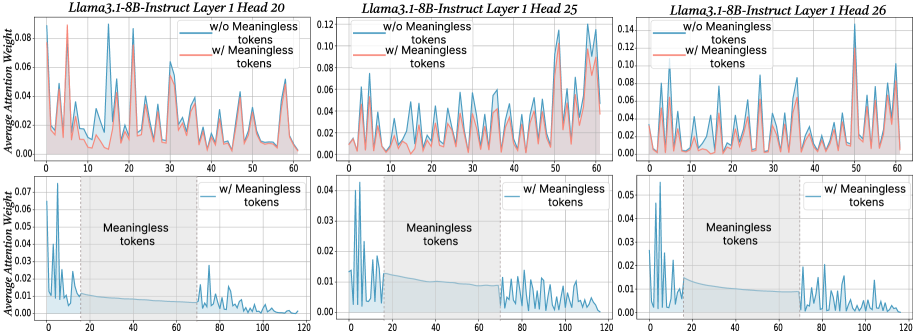
The image displays a 2x3 grid of six line charts analyzing the "Average Attention Weight" across token positions for different attention heads in the Llama3.1-8B-Instruct model. The top row compares attention distributions with and without the inclusion of "Meaningless tokens." The bottom row isolates and highlights the attention pattern specifically within the region containing these "Meaningless tokens."
### Components/Axes
* **Titles:** Each of the six subplots has a title specifying the model layer and attention head:
* Top Left: `Llama3.1-8B-Instruct Layer 1 Head 20`
* Top Center: `Llama3.1-8B-Instruct Layer 1 Head 25`
* Top Right: `Llama3.1-8B-Instruct Layer 1 Head 26`
* Bottom Left: `Llama3.1-8B-Instruct Layer 1 Head 20` (implied by position)
* Bottom Center: `Llama3.1-8B-Instruct Layer 1 Head 25` (implied by position)
* Bottom Right: `Llama3.1-8B-Instruct Layer 1 Head 26` (implied by position)
* **Y-Axis:** All charts share the same label: `Average Attention Weight`. The scale varies per chart.
* **X-Axis:** Represents token position index. The top row charts range from 0 to 60. The bottom row charts range from 0 to 120.
* **Legend (Top Row Charts):** Located in the top-left corner of each top-row chart.
* Blue Line: `w/o Meaningless tokens`
* Red Line: `w/ Meaningless tokens`
* **Legend (Bottom Row Charts):** Located in the top-right corner of each bottom-row chart.
* Blue Line: `w/ Meaningless tokens`
* **Annotations (Bottom Row Charts):** A shaded gray rectangular region is labeled `Meaningless tokens`. This region spans approximately from token position 18 to 72 on the x-axis.
### Detailed Analysis
**Top Row: Comparison of Attention Distributions**
* **Layer 1 Head 20 (Top Left):**
* **Trend:** Both lines show a highly volatile, spiky pattern. The red line (`w/ Meaningless tokens`) generally exhibits higher peaks than the blue line (`w/o Meaningless tokens`).
* **Data Points (Approximate):** The y-axis ranges from 0.00 to 0.08. Major peaks for the red line occur near token positions 5 (~0.08), 12 (~0.07), 22 (~0.065), and 55 (~0.05). The blue line's peaks are consistently lower, with its highest near position 12 (~0.06).
* **Layer 1 Head 25 (Top Center):**
* **Trend:** Similar volatile pattern. The red line shows significantly higher attention weights, especially in the latter half of the sequence (positions 40-60).
* **Data Points (Approximate):** The y-axis ranges from 0.00 to 0.12. The red line has very high peaks near positions 50 (~0.12) and 58 (~0.11). The blue line's highest peak is near position 50 (~0.08).
* **Layer 1 Head 26 (Top Right):**
* **Trend:** Both lines are spiky. The red line's peaks are more pronounced and frequent compared to the blue line.
* **Data Points (Approximate):** The y-axis ranges from 0.00 to 0.14. The red line has its highest peak near position 50 (~0.14). Other major red peaks are near positions 5 (~0.10), 22 (~0.09), and 35 (~0.08). The blue line's maximum is near position 50 (~0.10).
**Bottom Row: Focus on Meaningless Token Region**
* **Layer 1 Head 20 (Bottom Left):**
* **Trend:** The attention weight is high at the very beginning (positions 0-10), drops sharply at the start of the "Meaningless tokens" region (~pos 18), remains low and relatively flat within the region, and then shows a small, volatile recovery after the region ends (~pos 72).
* **Data Points (Approximate):** Y-axis: 0.00 to 0.07. Initial peak >0.07. Within the shaded region (pos ~18-72), weight hovers near 0.00-0.01. Post-region peaks reach ~0.02.
* **Layer 1 Head 25 (Bottom Center):**
* **Trend:** Similar pattern: high initial attention, a drop into the meaningless region, low/flat attention within it, and a volatile recovery afterward.
* **Data Points (Approximate):** Y-axis: 0.00 to 0.04. Initial peak >0.04. Within the shaded region, weight is very low (~0.00-0.005). Post-region peaks reach ~0.02.
* **Layer 1 Head 26 (Bottom Right):**
* **Trend:** Follows the same pattern as the other two heads in this row.
* **Data Points (Approximate):** Y-axis: 0.00 to 0.05. Initial peak >0.05. Within the shaded region, weight is minimal (~0.00-0.01). Post-region peaks reach ~0.03.
### Key Observations
1. **Impact of Meaningless Tokens:** Including meaningless tokens (red lines, top row) consistently increases the magnitude of attention weight peaks compared to excluding them (blue lines, top row).
2. **Attention Collapse:** The bottom row charts clearly demonstrate that for these specific heads in Layer 1, attention weight collapses to near-zero within the span of meaningless tokens.
3. **Post-Collapse Recovery:** After the meaningless token region ends, attention patterns resume with volatility, but the peak weights are generally lower than the initial pre-region peaks.
4. **Consistency Across Heads:** The qualitative behavior (high initial attention, collapse in meaningless region, partial recovery) is consistent across the three analyzed attention heads (20, 25, 26) in Layer 1.
### Interpretation
The data suggests that "Meaningless tokens" (which could be padding, separators, or other non-semantic tokens) have a profound and disruptive effect on the early-layer attention mechanism of this model.
* **Mechanism:** The collapse of attention within the meaningless token region indicates that these heads effectively "ignore" or "skip over" this span of tokens. The model does not allocate significant computational focus to them.
* **Purpose:** This behavior is likely a learned, efficient processing strategy. By suppressing attention to non-informative tokens, the model can preserve its attention capacity for meaningful content before and after this region.
* **Comparison:** The top-row charts show that when the *entire sequence* (including meaningless tokens) is considered, the attention distribution is more "stretched" and peaks are higher. This is because the total attention mass (which sums to 1) is distributed over more tokens, but the model compensates by assigning extremely low weights to the meaningless block, thereby increasing the relative weight on meaningful tokens.
* **Anomaly/Notable Point:** The sharp, high attention peaks at the very beginning of the sequence (positions 0-10) in the bottom-row charts are striking. This may indicate a strong "recency" or "initial token" bias in these heads, where the model pays disproportionate attention to the first few tokens of the input, possibly for establishing context or as a default attention pattern.
DECODING INTELLIGENCE...