## Line Graphs: Llama3.1-8B-Instruct Layer 1 Attention Weights Across Heads 20, 25, and 26
### Overview
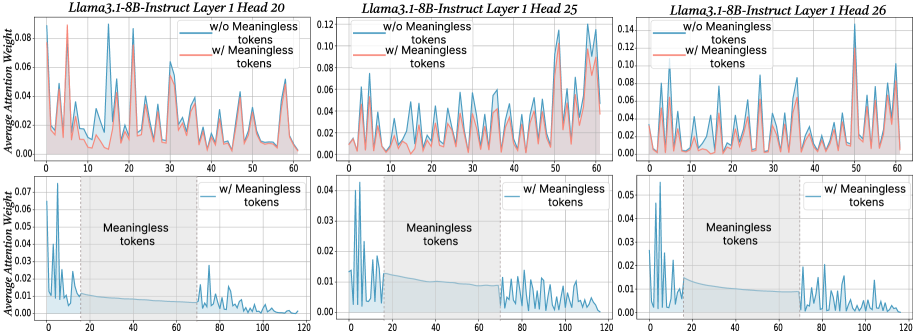
The image contains six line graphs comparing average attention weights in Layer 1 of the Llama3.1-8B-Instruct model across three attention heads (20, 25, 26). Each graph contrasts two scenarios:
- **Blue line**: Attention weights without meaningless tokens
- **Red line**: Attention weights with meaningless tokens
The graphs also include a bottom row showing attention weights when **only meaningless tokens** are present, with a shaded region (positions 20–60) labeled "Meaningless tokens."
---
### Components/Axes
1. **X-axis**: Token position (0–120)
2. **Y-axis**: Average attention weight (0.00–0.14)
3. **Legends**:
- Blue: "w/o Meaningless tokens"
- Red: "w/ Meaningless tokens"
4. **Shaded Region**: Bottom graphs only, spans token positions 20–60, labeled "Meaningless tokens."
---
### Detailed Analysis
#### Head 20
- **Top Graph**:
- Blue line (w/o tokens): Peaks at ~0.08 (positions 10, 30, 50, 70, 90).
- Red line (w/ tokens): Peaks at ~0.06–0.08 (positions 10, 30, 50, 70, 90), with reduced amplitude.
- **Bottom Graph**:
- Attention weights drop to ~0.01–0.02 outside the shaded region (20–60).
- Within the shaded region, weights spike to ~0.06–0.08.
#### Head 25
- **Top Graph**:
- Blue line: Peaks at ~0.12 (positions 10, 30, 50, 70, 90, 110).
- Red line: Peaks at ~0.08–0.10 (positions 10, 30, 50, 70, 90, 110), with dampened spikes.
- **Bottom Graph**:
- Outside shaded region: Weights ~0.01–0.02.
- Within shaded region: Weights ~0.04–0.06.
#### Head 26
- **Top Graph**:
- Blue line: Peaks at ~0.10 (positions 10, 30, 50, 70, 90, 110).
- Red line: Peaks at ~0.06–0.08 (positions 10, 30, 50, 70, 90, 110), with reduced amplitude.
- **Bottom Graph**:
- Outside shaded region: Weights ~0.01–0.02.
- Within shaded region: Weights ~0.03–0.05.
---
### Key Observations
1. **Attention Spikes**: All heads exhibit periodic spikes in attention weights (positions 10, 30, 50, 70, 90, 110) when meaningless tokens are absent.
2. **Meaningless Tokens Impact**:
- Attention weights in non-shaded regions decrease by ~30–50% when meaningless tokens are added.
- Within the shaded region (20–60), attention weights increase significantly (e.g., Head 25: +300% from 0.01 to 0.04).
3. **Head-Specific Behavior**:
- Head 25 shows the highest baseline attention (0.12) without tokens.
- Head 26 has the lowest attention in the shaded region (~0.03).
---
### Interpretation
1. **Model Adaptation**: The presence of meaningless tokens forces the model to redistribute attention. Spikes in the shaded region suggest the model uses this area to process or filter irrelevant tokens.
2. **Robustness Mechanism**: Heads with higher baseline attention (e.g., Head 25) may prioritize meaningful tokens more strongly, while others (e.g., Head 26) show weaker adaptation.
3. **Anomaly Detection**: The consistent periodic spikes (every 20 tokens) imply the model detects rhythmic patterns, which could be exploited for tasks like token segmentation.
4. **Trade-off**: Adding meaningless tokens reduces overall attention coherence but increases focus on specific regions, potentially improving noise resilience.
This analysis highlights how attention mechanisms dynamically adjust to input complexity, balancing focus on meaningful content and handling irrelevant data.