## Diagram: Task 0a938d79 Processing Flow
### Overview
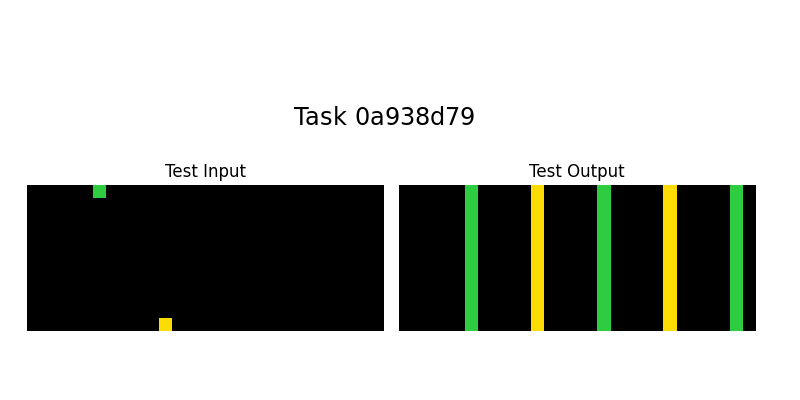
The image depicts a two-part diagram labeled "Test Input" (left) and "Test Output" (right), connected by an implied transformation process. The input contains two colored elements, while the output consists of five vertical bars with alternating colors.
### Components/Axes
- **Title**: "Task 0a938d79" (centered at the top)
- **Left Section**:
- Label: "Test Input" (above the input area)
- Elements:
- Green square (top-left position)
- Yellow square (bottom-center position)
- **Right Section**:
- Label: "Test Output" (above the output area)
- Elements:
- Five vertical bars alternating between green and yellow (left-to-right order: green, yellow, green, yellow, green)
### Detailed Analysis
- **Input Elements**:
- Two discrete colored blocks (green and yellow) with no explicit labels or numerical values.
- Spatial positioning: Green block is isolated at the top-left; yellow block is centered at the bottom.
- **Output Elements**:
- Five vertical bars with consistent width and height.
- Color pattern: Alternating green/yellow, starting and ending with green.
- No numerical labels, axis markers, or legends present.
### Key Observations
1. **Color Consistency**: The same two colors (green and yellow) are used in both input and output, suggesting a direct relationship between input elements and output states.
2. **Output Pattern**: The alternating color sequence in the output implies a cyclical or state-dependent transformation.
3. **Input-Output Ratio**: Two input elements produce five output elements, indicating a non-1:1 mapping.
### Interpretation
The diagram likely represents a state transition or process flow where:
- The **green input** triggers an initial state (first green bar).
- The **yellow input** introduces a secondary state (first yellow bar).
- The alternating output pattern suggests a feedback loop or iterative process, with the final green bar possibly indicating a return to the initial state.
The absence of numerical data or explicit labels limits quantitative analysis, but the spatial and color-based relationships imply a deterministic transformation rule. The task ID "0a938d79" may reference a specific algorithm or test case in a larger system.