## Diagram: Modular Grid Indexing Patterns
### Overview
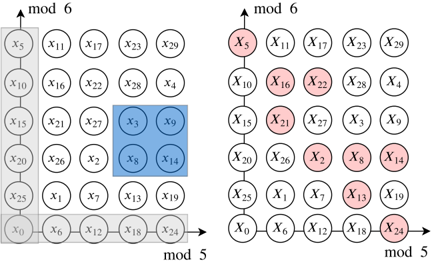
The image displays two side-by-side technical diagrams illustrating patterns of indices or elements within a two-dimensional modular grid system. Both diagrams share the same underlying 5x5 grid structure of labeled circles but highlight different subsets using color overlays. The diagrams appear to represent concepts from discrete mathematics, computer science (e.g., memory indexing, convolution operations), or signal processing.
### Components/Axes
* **Grid Structure:** Each diagram is a 5x5 grid of circles.
* **Axes Labels:**
* **Horizontal Axis (Bottom):** Labeled `mod 5`. An arrow points to the right.
* **Vertical Axis (Left):** Labeled `mod 6`. An arrow points upward.
* **Element Labels:** Each circle contains a label in the format `x` followed by a subscript number (e.g., `x5`, `x11`). The labels are not sequential in a simple row-major or column-major order.
* **Color Highlights (Left Diagram):**
* **Blue Square:** A 2x2 block of circles in the center-right area.
* **Gray L-Shape:** A region covering the entire first column and the entire bottom row.
* **Color Highlights (Right Diagram):**
* **Red Circles:** A set of circles forming a specific, non-contiguous pattern across the grid.
### Detailed Analysis
**1. Grid Label Transcription (Left to Right, Top to Bottom):**
The labeling scheme is consistent across both diagrams. The grid positions are as follows (Row, Column):
* **Row 1 (Top):** `x5`, `x11`, `x17`, `x23`, `x29`
* **Row 2:** `x10`, `x16`, `x22`, `x28`, `x4`
* **Row 3:** `x15`, `x21`, `x27`, `x3`, `x9`
* **Row 4:** `x20`, `x26`, `x2`, `x8`, `x14`
* **Row 5 (Bottom):** `x25`, `x1`, `x7`, `x13`, `x19`
* **Extra Column (Right of Row 5):** `x0`, `x6`, `x12`, `x18`, `x24` (This appears to be a continuation of the bottom row, extending the `mod 5` axis).
**2. Left Diagram - Highlighted Regions:**
* **Blue Square (2x2 Block):** Located at the intersection of Rows 3-4 and Columns 4-5.
* Top-left: `x3` (Row 3, Column 4)
* Top-right: `x9` (Row 3, Column 5)
* Bottom-left: `x8` (Row 4, Column 4)
* Bottom-right: `x14` (Row 4, Column 5)
* **Gray L-Shape:**
* **Vertical Leg (Leftmost Column):** `x5`, `x10`, `x15`, `x20`, `x25`.
* **Horizontal Leg (Bottom Row):** `x25`, `x1`, `x7`, `x13`, `x19`, `x0`, `x6`, `x12`, `x18`, `x24`. (Note: `x25` is the corner element, part of both legs).
**3. Right Diagram - Highlighted Pattern (Red Circles):**
The red circles form a diagonal, stride-2 pattern. Starting from the top-left and moving down-right:
* `x5` (Row 1, Column 1)
* `x16` (Row 2, Column 2)
* `x21` (Row 3, Column 2) - *Note: This breaks a perfect diagonal, staying in Column 2.*
* `x2` (Row 4, Column 3)
* `x8` (Row 4, Column 4) - *Note: This is adjacent to the previous point in the same row.*
* `x14` (Row 4, Column 5) - *Note: This is adjacent to the previous point in the same row.*
* `x13` (Row 5, Column 4)
* `x24` (Extra Column, Column 5 of the extended bottom row)
**Visual Trend Verification (Right Diagram):** The red pattern does not follow a simple straight line. It begins at the top-left corner (`x5`), moves to the center (`x16`, `x21`), then clusters in the lower-right quadrant (`x2`, `x8`, `x14`, `x13`), and finally jumps to the far bottom-right (`x24`). This suggests a complex indexing rule, not a simple linear or diagonal stride.
### Key Observations
1. **Non-Sequential Labeling:** The `x` indices do not follow a simple raster scan order. For example, `x0` is at the bottom-right, and `x29` is at the top-right. The labeling appears to be based on a specific mathematical function of the (row, column) coordinates modulo the axis values.
2. **Modular Arithmetic Context:** The `mod 5` and `mod 6` axes explicitly frame the grid as a representation of a 2D modular space, likely Z₅ × Z₆.
3. **Pattern Contrast:** The left diagram highlights contiguous, block-like regions (a square and an L-shaped border). The right diagram highlights a sparse, non-contiguous, and irregular pattern.
4. **Shared Elements:** Some elements are highlighted in both diagrams (e.g., `x8`, `x14` are in the blue square on the left and are red on the right; `x5` is in the gray column on the left and is red on the right). This may indicate an intersection or relationship between the two defined sets.
### Interpretation
These diagrams likely serve as a visual aid for understanding **index mapping** or **access patterns** within a structured data space defined by two different moduli (5 and 6). This is a common concept in areas like:
* **Cryptography:** Visualizing permutation patterns or S-boxes.
* **Computer Architecture:** Illustrating memory bank conflicts or interleaving schemes where addresses are mapped modulo different bank counts.
* **Algorithm Design:** Showing the access pattern of a nested loop with non-unit strides, or the footprint of a convolution kernel (the blue square) on an input feature map.
* **Error-Correcting Codes:** Representing parity check matrices or Tanner graphs.
The **left diagram** could represent a **"neighborhood" or "kernel"** (the blue 2x2 square) and a **"boundary condition"** (the gray L-shape, perhaps indicating padding or an edge region). The **right diagram** likely illustrates a specific **sampling pattern, stride, or a set of indices** generated by a function like `(i * a + j * b) mod N`. The irregularity of the red pattern suggests the function parameters (a, b) are chosen such that the pattern does not align neatly with the grid's primary diagonals.
The core informational purpose is to contrast a simple, localized spatial region (left) with a more complex, distributed index set (right) within the same modular coordinate system. This helps in analyzing properties like locality, dispersion, or coverage of different algorithms or data structures operating on this grid.