## Diagram: Modular Node Grid Structure
### Overview
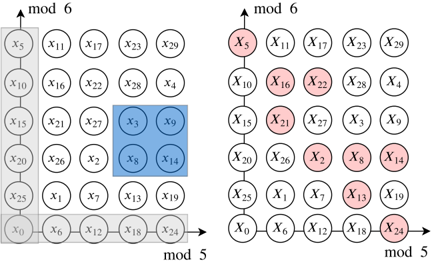
The image depicts two modular grids labeled "mod 6" (left) and "mod 5" (right), each containing nodes arranged in rows and columns. Nodes are numbered with "x" followed by integers (e.g., x5, x10). Highlighted nodes are color-coded: blue in the left grid and pink in the right grid. The left grid includes a vertical column of nodes on the far left, while the right grid features a horizontal line of nodes at the bottom.
### Components/Axes
- **Labels**:
- Left grid: "mod 6" (top-left corner).
- Right grid: "mod 5" (top-left corner).
- **Node Structure**:
- **Left Grid (mod 6)**:
- 6 rows × 6 columns of nodes.
- Vertical column on the far left: x5, x10, x15, x20, x25, x0 (connected by lines).
- Highlighted nodes: x3, x8, x9, x14 (blue).
- **Right Grid (mod 5)**:
- 6 rows × 6 columns of nodes.
- Horizontal line at the bottom: x0, x6, x12, x18, x24 (connected by lines).
- Highlighted nodes: x5, x10, x15, x16, x21, x22, x27, x28, x3, x9, x2, x8, x14, x24 (pink).
- **Connections**:
- Vertical lines in the left grid connect the far-left column.
- Horizontal lines in the right grid connect the bottom row.
### Detailed Analysis
- **Node Distribution**:
- Left grid nodes are numbered sequentially in rows (e.g., x1, x2, x3, ..., x29).
- Right grid nodes follow a similar pattern but with a horizontal line at the bottom.
- **Highlighted Nodes**:
- **Left Grid (blue)**:
- x3 (row 3, column 3), x8 (row 4, column 3), x9 (row 4, column 4), x14 (row 5, column 4).
- **Right Grid (pink)**:
- x5 (row 1, column 1), x10 (row 2, column 1), x15 (row 3, column 1), x16 (row 3, column 2), x21 (row 4, column 1), x22 (row 4, column 2), x27 (row 5, column 3), x28 (row 5, column 4), x3 (row 1, column 3), x9 (row 2, column 4), x2 (row 3, column 2), x8 (row 4, column 3), x14 (row 5, column 4), x24 (row 6, column 5).
- **Positioning**:
- Highlighted nodes in the left grid form a 2×2 block in the lower-middle region.
- Highlighted nodes in the right grid are scattered, with a concentration in the lower-right quadrant.
### Key Observations
1. **Modular Grouping**:
- The left grid (mod 6) and right grid (mod 5) suggest distinct modular groupings, possibly representing different mathematical or computational partitions.
2. **Highlighted Nodes**:
- The blue-highlighted nodes in the left grid (x3, x8, x9, x14) may indicate critical or special nodes within the mod 6 structure.
- The pink-highlighted nodes in the right grid (e.g., x24, x14, x8) could represent overlapping or shared elements between the two modular systems.
3. **Connection Patterns**:
- The vertical column in the left grid and horizontal line in the right grid imply hierarchical or sequential relationships within each modular system.
### Interpretation
The diagram likely represents a modular system where nodes are organized into two distinct partitions (mod 6 and mod 5). The highlighted nodes may signify key elements or intersections between these partitions. The vertical and horizontal connections suggest hierarchical or sequential dependencies within each modular group. The overlapping highlighted nodes (e.g., x3, x8, x14) could indicate shared or critical nodes that bridge the two modular systems. This structure might be used in applications such as network topology, data partitioning, or algorithmic design, where modularity and node relationships are critical.
### Notes
- No numerical data or trends are explicitly provided; the focus is on structural and positional relationships.
- The absence of legends or axis markers limits quantitative analysis, but the color-coding and node labels provide qualitative insights.
- The diagram emphasizes modular organization and node connectivity, with highlighted nodes serving as focal points for analysis.