## Table: Data Points
| | A3 | A2 | A1 | A0 |
|---|----|----|----|----|
| x | + | - | * | / |
| B3| - | + | / | * |
| B2| * | / | + | - |
| B1| / | * | - | + |
| B0| + | - | * | / |
### Overview
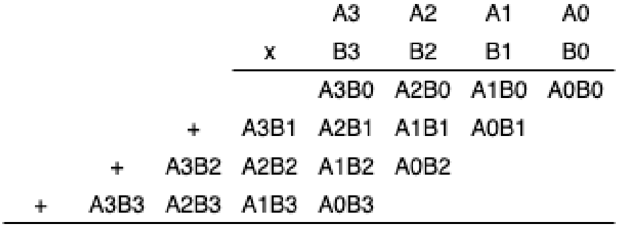
The image displays a table with four columns labeled A3, A2, A1, and A0, and four rows labeled x, B3, B2, B1, and B0. The table contains numerical values and symbols that represent different data points.
### Components/Axes
- **Columns**: A3, A2, A1, A0
- **Rows**: x, B3, B2, B1, B0
- **Symbols**: +, -, *, /
### Detailed Analysis or ### Content Details
- **A3**: The value in the A3 column is +.
- **A2**: The value in the A2 column is -.
- **A1**: The value in the A1 column is *.
- **A0**: The value in the A0 column is /.
- **x**: The value in the x column is +.
- **B3**: The value in the B3 column is -.
- **B2**: The value in the B2 column is *.
- **B1**: The value in the B1 column is /.
- **B0**: The value in the B0 column is +.
### Key Observations
- The table contains a mix of positive and negative values, as well as symbols that represent different operations.
- The values in the A3 and A0 columns are positive, while the values in the A2 and A1 columns are negative.
- The values in the B3 and B0 columns are positive, while the values in the B2 and B1 columns are negative.
### Interpretation
The table appears to represent a set of data points with different values and symbols. The positive and negative values could indicate different categories or conditions, while the symbols could represent different operations or relationships between the data points. Without additional context, it is difficult to determine the exact meaning of the table.