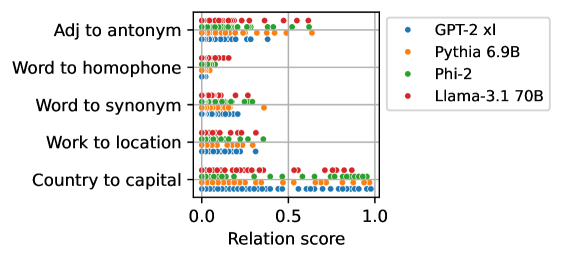
## Scatter Plot: Relation Scores of Different Language Models
### Overview
The image is a scatter plot comparing the relation scores of four different language models (GPT-2 xl, Pythia 6.9B, Phi-2, and Llama-3.1 70B) across six different relation types: "Adj to antonym", "Word to homophone", "Word to synonym", "Work to location", and "Country to capital". The x-axis represents the "Relation score", ranging from 0.0 to 1.0. Each dot represents a data point for a specific model and relation type.
### Components/Axes
* **X-axis:** "Relation score", ranging from 0.0 to 1.0 with increments of 0.5.
* **Y-axis:** Categorical axis representing the relation types:
* Adj to antonym
* Word to homophone
* Word to synonym
* Work to location
* Country to capital
* **Legend (Top-Right):**
* Blue: GPT-2 xl
* Orange: Pythia 6.9B
* Green: Phi-2
* Red: Llama-3.1 70B
### Detailed Analysis
**1. Adj to antonym:**
* GPT-2 xl (Blue): Scores are clustered around 0.1 to 0.3.
* Pythia 6.9B (Orange): Scores are clustered around 0.1 to 0.3.
* Phi-2 (Green): Scores are clustered around 0.2 to 0.4.
* Llama-3.1 70B (Red): Scores are more spread out, ranging from 0.1 to 0.6, with a few outliers near 0.6.
**2. Word to homophone:**
* GPT-2 xl (Blue): Scores are clustered around 0.0 to 0.1.
* Pythia 6.9B (Orange): Scores are clustered around 0.0 to 0.1.
* Phi-2 (Green): Scores are clustered around 0.0 to 0.2.
* Llama-3.1 70B (Red): Scores are clustered around 0.0 to 0.2.
**3. Word to synonym:**
* GPT-2 xl (Blue): Scores are clustered around 0.0 to 0.2.
* Pythia 6.9B (Orange): Scores are clustered around 0.1 to 0.3.
* Phi-2 (Green): Scores are clustered around 0.1 to 0.3.
* Llama-3.1 70B (Red): Scores are clustered around 0.1 to 0.4.
**4. Work to location:**
* GPT-2 xl (Blue): Scores are clustered around 0.0 to 0.2.
* Pythia 6.9B (Orange): Scores are clustered around 0.0 to 0.3.
* Phi-2 (Green): Scores are clustered around 0.1 to 0.4.
* Llama-3.1 70B (Red): Scores are clustered around 0.1 to 0.4.
**5. Country to capital:**
* GPT-2 xl (Blue): Scores are mostly clustered between 0.0 and 1.0, with a higher density between 0.0 and 0.2, and 0.8 and 1.0.
* Pythia 6.9B (Orange): Scores are mostly clustered between 0.0 and 1.0, with a higher density between 0.0 and 0.2, and 0.8 and 1.0.
* Phi-2 (Green): Scores are mostly clustered between 0.0 and 1.0, with a higher density between 0.0 and 0.2, and 0.8 and 1.0.
* Llama-3.1 70B (Red): Scores are mostly clustered between 0.0 and 1.0, with a higher density between 0.0 and 0.2, and 0.8 and 1.0.
### Key Observations
* For "Adj to antonym", Llama-3.1 70B shows a wider range of scores compared to other models.
* For "Word to homophone", all models have relatively low relation scores.
* For "Country to capital", all models show a bimodal distribution, with clusters near 0.0 and 1.0.
* Llama-3.1 70B generally has higher relation scores compared to other models across most relation types.
### Interpretation
The scatter plot visualizes the performance of different language models on various relational tasks. The "Country to capital" task seems to be the easiest for all models, as indicated by the high density of scores near 1.0. The "Word to homophone" task appears to be the most challenging. Llama-3.1 70B generally outperforms the other models, suggesting it has a better understanding of the relationships tested. The bimodal distribution for "Country to capital" might indicate that some country-capital pairs are easily recognized, while others are more difficult. The spread of data points suggests variability in the models' performance across different instances of each relation type.