\n
## Scatter Plot: Relation Scores for Different Language Models
### Overview
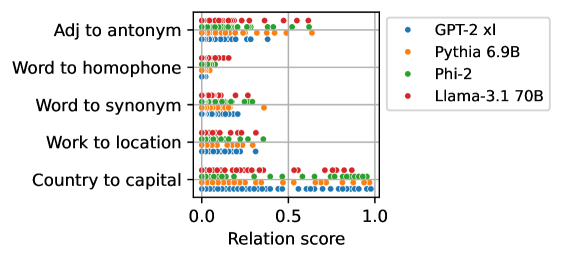
The image presents a scatter plot comparing the performance of four language models (GPT-2 xl, Pythia 6.9B, Phi-2, and Llama-3.1 70B) across five different relation types: "Adj to antonym", "Word to homophone", "Word to synonym", "Work to location", and "Country to capital". The x-axis represents the "Relation score", ranging from 0.0 to 1.0. Each point on the plot represents the score achieved by a specific language model for a specific relation type.
### Components/Axes
* **X-axis:** "Relation score" (Scale: 0.0 to 1.0, with markers at 0.0, 0.5, and 1.0)
* **Y-axis:** Relation types, listed vertically:
* Adj to antonym
* Word to homophone
* Word to synonym
* Work to location
* Country to capital
* **Legend:** Located in the top-right corner, mapping colors to language models:
* Blue: GPT-2 xl
* Orange: Pythia 6.9B
* Green: Phi-2
* Red: Llama-3.1 70B
### Detailed Analysis
Let's analyze each relation type and the performance of each model:
* **Adj to antonym:** All models cluster between approximately 0.6 and 1.0. GPT-2 xl (blue) appears to have a slight concentration around 0.7-0.8. Pythia 6.9B (orange) is spread between 0.6 and 0.9. Phi-2 (green) is concentrated around 0.8-0.9. Llama-3.1 70B (red) is mostly between 0.7 and 1.0.
* **Word to homophone:** Similar to "Adj to antonym", all models score between approximately 0.6 and 1.0. GPT-2 xl (blue) is concentrated around 0.7-0.8. Pythia 6.9B (orange) is spread between 0.6 and 0.9. Phi-2 (green) is concentrated around 0.8-0.9. Llama-3.1 70B (red) is mostly between 0.7 and 1.0.
* **Word to synonym:** All models score between approximately 0.4 and 1.0. GPT-2 xl (blue) is concentrated around 0.5-0.7. Pythia 6.9B (orange) is spread between 0.6 and 0.9. Phi-2 (green) is concentrated around 0.7-0.9. Llama-3.1 70B (red) is mostly between 0.7 and 1.0.
* **Work to location:** All models score between approximately 0.2 and 0.8. GPT-2 xl (blue) is concentrated around 0.3-0.5. Pythia 6.9B (orange) is spread between 0.4 and 0.7. Phi-2 (green) is concentrated around 0.5-0.7. Llama-3.1 70B (red) is mostly between 0.5 and 0.8.
* **Country to capital:** All models score between approximately 0.6 and 1.0. GPT-2 xl (blue) is concentrated around 0.7-0.9. Pythia 6.9B (orange) is spread between 0.7 and 0.9. Phi-2 (green) is concentrated around 0.8-1.0. Llama-3.1 70B (red) is mostly between 0.7 and 1.0.
### Key Observations
* The "Work to location" relation consistently yields the lowest relation scores across all models.
* Llama-3.1 70B (red) generally achieves higher scores than the other models, particularly in "Word to synonym" and "Country to capital".
* GPT-2 xl (blue) tends to have the lowest scores, especially in "Work to location".
* The scores are generally clustered, with less variance within each relation type.
### Interpretation
The scatter plot demonstrates the ability of different language models to understand and quantify relationships between concepts. The varying scores across relation types suggest that some relationships are inherently easier for these models to grasp than others. The consistently low scores for "Work to location" might indicate that this relationship requires more complex reasoning or world knowledge that these models currently lack.
The superior performance of Llama-3.1 70B suggests that larger models with more parameters are better equipped to capture these relationships. The clustering of scores within each relation type indicates a degree of consistency in how these models perceive these relationships, but the variations between models highlight the differences in their underlying knowledge and reasoning capabilities. The plot provides a comparative assessment of these models' relational understanding, which is crucial for tasks like question answering, knowledge graph completion, and semantic reasoning.