## Line Chart: Ratio of Particles or WCET vs Importance Ratio (pos / braking)
### Overview
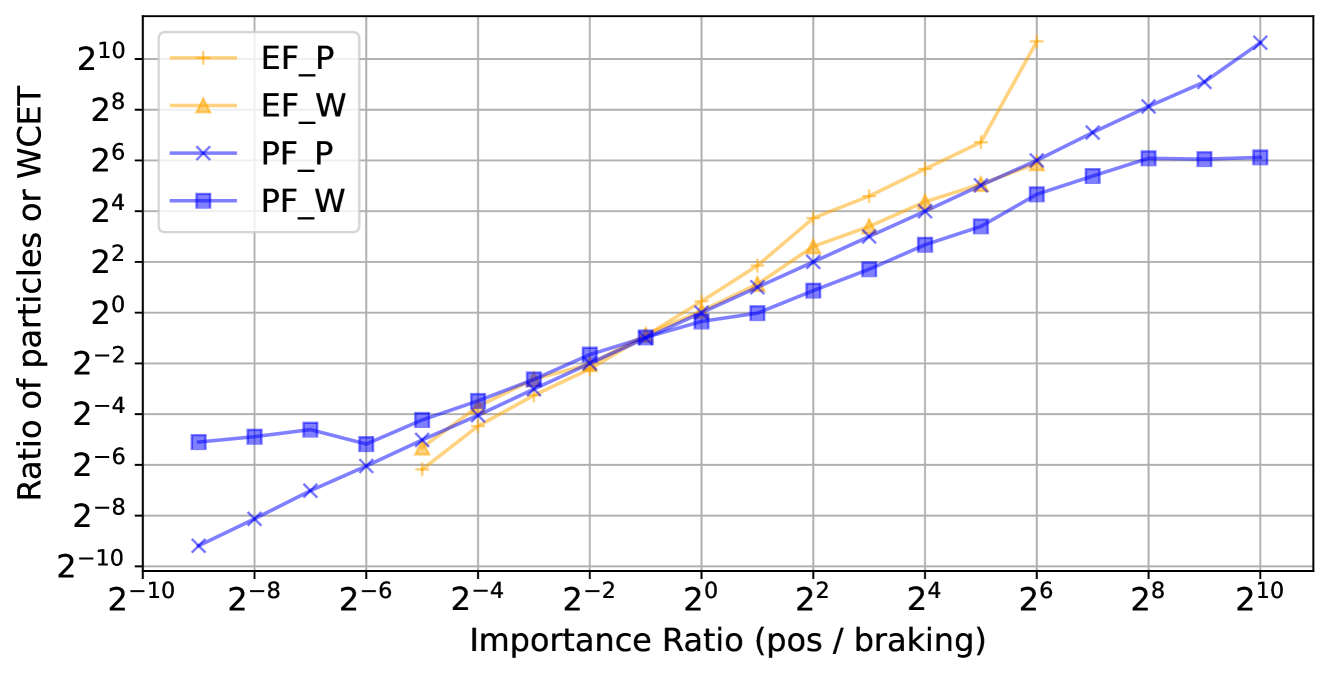
The chart displays four data series representing the ratio of particles or WCET (Worst-Case Execution Time) across varying importance ratios (pos / braking). The x-axis uses a logarithmic scale from 2⁻¹⁰ to 2¹⁰, while the y-axis also uses a logarithmic scale from 2⁻¹⁰ to 2¹⁰. The legend is positioned in the top-right corner, with distinct markers and colors for each series.
### Components/Axes
- **X-axis**: "Importance Ratio (pos / braking)" with values ranging from 2⁻¹⁰ to 2¹⁰ (logarithmic scale).
- **Y-axis**: "Ratio of particles or WCET" with values from 2⁻¹⁰ to 2¹⁰ (logarithmic scale).
- **Legend**:
- **EF_P**: Orange dash (triangle marker).
- **EF_W**: Orange triangle (triangle marker).
- **PF_P**: Blue cross (cross marker).
- **PF_W**: Blue square (square marker).
### Detailed Analysis
1. **EF_P (Orange Dash)**:
- Starts near 2⁻⁸ at 2⁻¹⁰ importance ratio.
- Increases steadily, reaching ~2⁻² at 2⁰.
- Sharp spike to ~2⁸ at 2⁶, then stabilizes near 2⁸ at 2¹⁰.
2. **EF_W (Orange Triangle)**:
- Begins near 2⁻⁸ at 2⁻¹⁰.
- Rises gradually, peaking at ~2⁴ at 2⁴.
- Drops slightly to ~2³ at 2⁶, then rises to ~2⁵ at 2¹⁰.
3. **PF_P (Blue Cross)**:
- Starts near 2⁻⁸ at 2⁻¹⁰.
- Increases steadily, reaching ~2⁻² at 2⁰.
- Rises to ~2⁴ at 2⁴, ~2⁶ at 2⁶, and ~2⁸ at 2¹⁰.
4. **PF_W (Blue Square)**:
- Begins near 2⁻⁸ at 2⁻¹⁰.
- Follows a similar trend to PF_P but with slightly lower values.
- Reaches ~2⁴ at 2⁴, ~2⁵ at 2⁶, and ~2⁶ at 2¹⁰.
### Key Observations
- **EF_P** exhibits a dramatic spike at 2⁶, far exceeding other series, suggesting an outlier or threshold effect.
- **EF_W** and **PF_P** show similar growth patterns but diverge at higher importance ratios.
- **PF_P** and **PF_W** are closely aligned, indicating minimal differentiation between their trends.
- All series follow a logarithmic scale, with values increasing exponentially as the importance ratio grows.
### Interpretation
The data suggests that **EF_P** experiences a significant deviation at 2⁶ importance ratio, potentially indicating a critical threshold or anomaly in particle/WCET behavior. The **PF** series (PF_P and PF_W) demonstrate consistent growth, implying stable or predictable relationships between importance ratio and particle/WCET ratios. The **EF** series (EF_P and EF_W) diverge more, with EF_P showing a pronounced spike, which could reflect distinct mechanisms or constraints in their respective models. The logarithmic scaling emphasizes exponential trends, highlighting the sensitivity of particle/WCET ratios to changes in importance ratio.