## Scatter Plot: Per-Task Success Rates: Real World vs World Model
### Overview
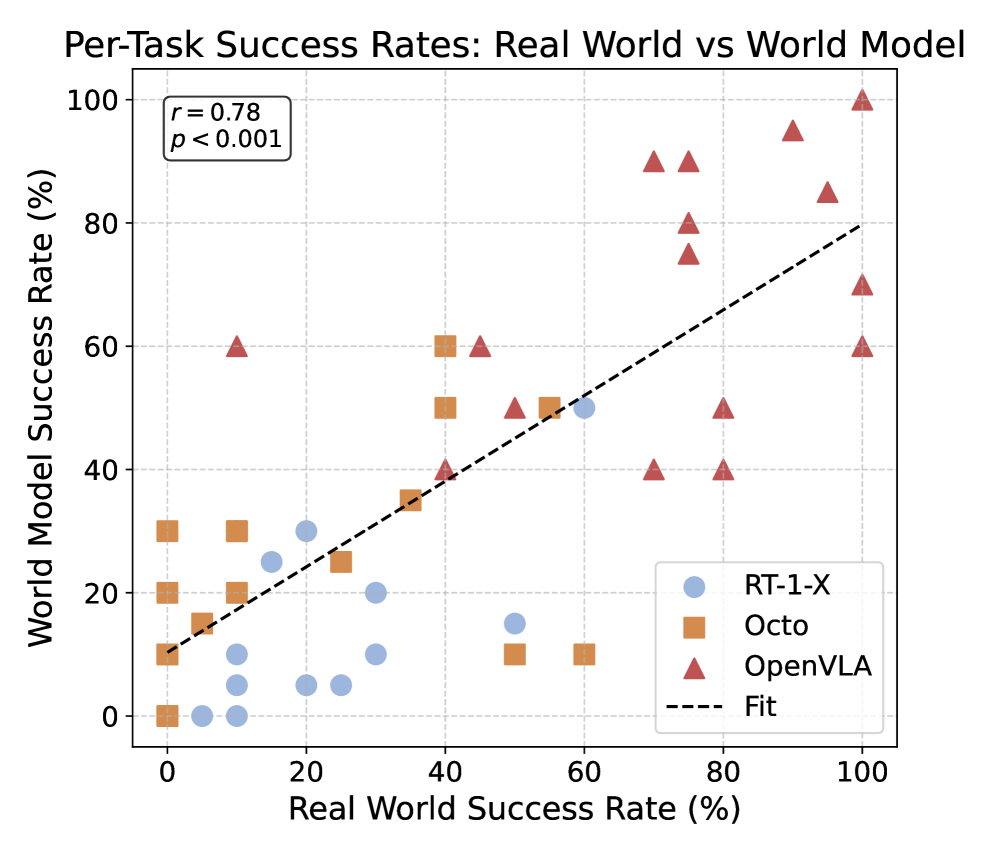
The image is a scatter plot comparing the per-task success rates of three different models (RT-1-X, Octo, and OpenVLA) in a real-world environment versus a world model environment. The plot also includes a line of best fit. The x-axis represents the real-world success rate, and the y-axis represents the world model success rate. The correlation coefficient (r) and p-value are displayed on the plot.
### Components/Axes
* **Title:** Per-Task Success Rates: Real World vs World Model
* **X-axis:** Real World Success Rate (%)
* Scale: 0 to 100, with tick marks at intervals of 20.
* **Y-axis:** World Model Success Rate (%)
* Scale: 0 to 100, with tick marks at intervals of 20.
* **Legend:** Located in the bottom-right corner.
* RT-1-X (light blue circles)
* Octo (orange squares)
* OpenVLA (red triangles)
* Fit (black dashed line)
* **Correlation Coefficient:** Located in the top-left corner, r = 0.78, p < 0.001
### Detailed Analysis
* **RT-1-X (light blue circles):** The data points are scattered, with most points having a low real-world success rate (below 40%) and a world model success rate ranging from 0% to 30%.
* (0, 0)
* (5, 0)
* (10, 5)
* (10, 10)
* (15, 25)
* (20, 5)
* (20, 20)
* (25, 25)
* (40, 20)
* (60, 50)
* (80, 15)
* **Octo (orange squares):** The data points are more spread out, with real-world success rates ranging from 0% to 100% and world model success rates ranging from 0% to 60%.
* (0, 0)
* (0, 10)
* (0, 20)
* (0, 30)
* (35, 35)
* (40, 50)
* (40, 60)
* (50, 10)
* (50, 50)
* (60, 10)
* (75, 50)
* (100, 60)
* **OpenVLA (red triangles):** The data points are concentrated towards higher real-world success rates (above 60%) and world model success rates (above 40%).
* (0, 60)
* (40, 40)
* (75, 40)
* (75, 50)
* (75, 75)
* (80, 90)
* (85, 90)
* (90, 95)
* (95, 70)
* (100, 100)
* **Fit (black dashed line):** The line of best fit shows a positive correlation between real-world success rate and world model success rate. It starts at approximately (0, 10) and extends to approximately (100, 80).
### Key Observations
* RT-1-X generally has lower success rates in both real-world and world model environments compared to Octo and OpenVLA.
* OpenVLA tends to have higher success rates in both environments.
* There is a positive correlation between real-world success rate and world model success rate, as indicated by the upward-sloping line of best fit and the correlation coefficient of 0.78.
* The p-value of less than 0.001 suggests that the correlation is statistically significant.
### Interpretation
The scatter plot suggests that the world model success rate is positively correlated with the real-world success rate across the three models. This implies that models that perform well in the real world also tend to perform well in the world model environment. The different clustering of data points for each model indicates varying levels of performance and consistency between real-world and world model environments. RT-1-X appears to struggle in both environments, while OpenVLA demonstrates higher success rates. Octo shows a wider range of performance, suggesting it may be more sensitive to specific task characteristics. The strong positive correlation (r = 0.78, p < 0.001) indicates a statistically significant relationship between real-world and world model performance.