## Chart Type: Line Graphs
### Overview
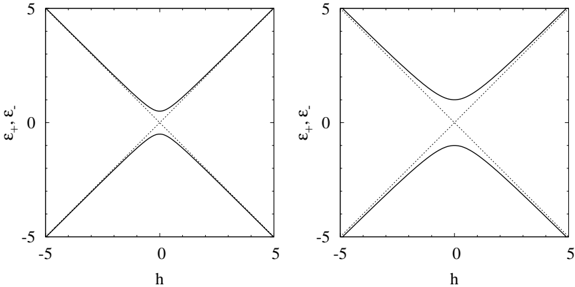
The image contains two line graphs, each displaying the relationship between a variable 'h' on the x-axis and 'ε+', 'ε-' on the y-axis. Both graphs show two solid lines and two dotted lines. The left graph shows the solid and dotted lines overlapping at h=0, while the right graph shows the solid lines diverging from the dotted lines near h=0.
### Components/Axes
* **X-axis (Horizontal):** 'h', with scale markers at -5, 0, and 5.
* **Y-axis (Vertical):** 'ε+', 'ε-', with scale markers at -5, 0, and 5.
* **Lines:** Each graph contains two solid lines and two dotted lines.
### Detailed Analysis
**Left Graph:**
* **Solid Lines:**
* One solid line slopes upwards from approximately (-5, -5) to (5, 5).
* The other solid line slopes downwards from approximately (-5, 5) to (5, -5).
* **Dotted Lines:**
* One dotted line slopes upwards from approximately (-5, -5) to (5, 5), overlapping with the solid line.
* The other dotted line slopes downwards from approximately (-5, 5) to (5, -5), overlapping with the solid line.
* The dotted lines intersect at (0,0).
**Right Graph:**
* **Solid Lines:**
* One solid line starts at approximately (-5, -5), curves upwards, flattens near (0, -2), then continues upwards to (5, 5).
* The other solid line starts at approximately (-5, 5), curves downwards, flattens near (0, 2), then continues downwards to (5, -5).
* **Dotted Lines:**
* One dotted line slopes upwards from approximately (-5, -5) to (5, 5).
* The other dotted line slopes downwards from approximately (-5, 5) to (5, -5).
* The dotted lines intersect at (0,0).
### Key Observations
* In the left graph, the solid and dotted lines are indistinguishable, suggesting they represent the same relationship under certain conditions.
* In the right graph, the solid lines deviate from the dotted lines near h=0, indicating a change in the relationship between 'h' and 'ε+', 'ε-' under different conditions.
* Both graphs show symmetry around the origin (0,0).
### Interpretation
The graphs likely represent energy levels (ε+, ε-) as a function of some parameter 'h'. The left graph could represent a simplified model where the relationship is linear. The right graph shows a more complex relationship where the energy levels exhibit a gap or splitting near h=0. This could be due to some interaction or perturbation that is not present in the simplified model. The dotted lines likely represent a theoretical or unperturbed state, while the solid lines represent the actual or perturbed state. The divergence of the solid lines from the dotted lines in the right graph indicates the effect of this perturbation.