\n
## Diagram: Band Structure Plots
### Overview
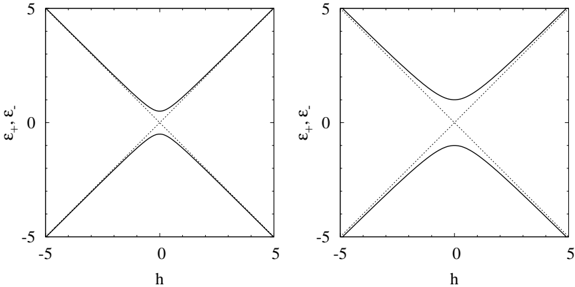
The image presents two identical band structure plots, likely representing the energy (εx, ε') as a function of a parameter 'h'. Both plots display a characteristic "hourglass" shape, indicative of a Dirac cone or similar band crossing. The plots are visually identical, suggesting they may represent the same system under slightly different conditions or a comparison of two different calculations.
### Components/Axes
Each plot has the following components:
* **X-axis:** Labeled "h", ranging from approximately -5 to 5. The units are not specified.
* **Y-axis:** Labeled "εx, ε'", ranging from approximately -5 to 5. The units are not specified, but likely represent energy.
* **Curves:** Each plot contains two curves, forming an "X" shape that intersects at the origin (h=0, εx, ε'=0). The curves appear to be symmetric with respect to both axes.
* **Plot Arrangement:** Two plots are arranged side-by-side horizontally.
### Detailed Analysis or Content Details
Both plots exhibit the same features. Let's analyze one plot and assume the other is identical.
* **Curve 1 (Upper):** This curve slopes downward from approximately (h=-5, εx, ε' = 5) to (h=0, εx, ε' = 0), then slopes upward to (h=5, εx, ε' = 5). It appears to be a linear relationship in each segment.
* **Curve 2 (Lower):** This curve slopes upward from approximately (h=-5, εx, ε' = -5) to (h=0, εx, ε' = 0), then slopes downward to (h=5, εx, ε' = -5). It also appears to be a linear relationship in each segment.
* **Intersection:** Both curves intersect at the origin (h=0, εx, ε' = 0).
* **Symmetry:** The plots are symmetric about both the x and y axes.
Due to the nature of the plot (lines without data points), precise numerical values cannot be extracted. The values provided are approximate based on visual inspection.
### Key Observations
* The identical nature of the two plots suggests they represent the same underlying physics.
* The "hourglass" shape is a hallmark of Dirac cones or similar band crossings, often found in materials with topological properties.
* The linear segments of the curves suggest a simple dispersion relation in those regions.
### Interpretation
The plots likely represent the electronic band structure of a material. The "hourglass" shape indicates a linear dispersion relation near the crossing point, which is characteristic of massless Dirac fermions. This suggests the material may exhibit interesting electronic properties, such as high mobility and topological protection. The parameter 'h' could represent a momentum component or some other relevant physical quantity. The fact that the two plots are identical suggests that the system is not sensitive to some parameter that might have been varied between the two calculations. The absence of specific labels or a caption makes it difficult to determine the exact material or system being studied. The plots are a visual representation of a mathematical relationship between energy and a parameter, and do not contain specific data points beyond the curves themselves.