## Phase Diagram: ε₊ vs. ε₋ vs. h
### Overview
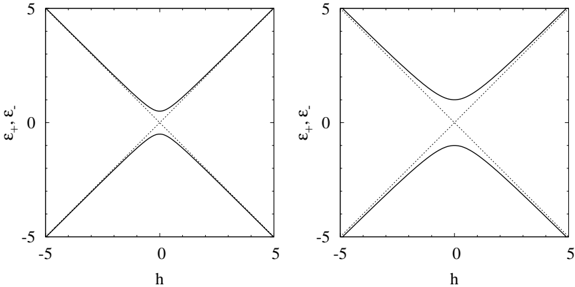
The image contains two side-by-side phase diagrams comparing the relationship between variables ε₊ (positive energy), ε₋ (negative energy), and h (magnetic field). Both diagrams feature X-shaped patterns with distinct line styles (solid/dashed vs. solid/dotted) to differentiate data series. The left diagram uses solid and dashed lines, while the right uses solid and dotted lines.
### Components/Axes
- **Axes**:
- **x-axis**: h (magnetic field), ranging from -5 to 5.
- **y-axis**: ε₊ (positive energy) and ε₋ (negative energy), ranging from -5 to 5.
- **Legends**:
- **Left Diagram**: Solid lines labeled "Stable Equilibrium," dashed lines labeled "Unstable Equilibrium."
- **Right Diagram**: Solid lines labeled "Phase A," dotted lines labeled "Phase B."
- **Spatial Grounding**:
- Legends are positioned in the **top-right** corner of each graph.
- Axes are centered, with h on the bottom and ε₊/ε₋ on the left.
### Detailed Analysis
- **Left Diagram**:
- **Solid Lines**: Form an X-shape with a pronounced dip at h=0, ε=0. Slopes are steep (≈±1) near the origin, flattening slightly toward the edges.
- **Dashed Lines**: Parallel to solid lines but shifted outward by ≈±0.5 units in ε₊/ε₋. Intersect at h=0, ε=0 with similar slope behavior.
- **Right Diagram**:
- **Solid Lines**: X-shape with a shallower curvature (≈±0.8 slope) compared to the left diagram. Dips at h=0, ε=0.
- **Dotted Lines**: Similar X-shape but with a narrower spread (≈±0.3 units in ε₊/ε₋). Intersect at h=0, ε=0 with reduced slope magnitude.
### Key Observations
1. Both diagrams exhibit symmetry about h=0 and ε=0.
2. The right diagram’s lines are less steep and more compressed than the left, suggesting a modified parameter (e.g., temperature, external field).
3. Dashed/dotted lines in both diagrams represent secondary states (unstable/phase B) relative to solid lines (stable/phase A).
### Interpretation
The diagrams likely model a physical system (e.g., magnetic or thermodynamic) where:
- **Left Diagram**: Represents baseline behavior, with solid lines indicating stable equilibria and dashed lines unstable states. The X-shape suggests competing energy contributions (ε₊ vs. ε₋) balanced by h.
- **Right Diagram**: Shows a perturbed system (e.g., higher temperature or altered field strength). The compressed X-shape implies reduced energy separation between phases, potentially indicating a critical point or phase transition near h=0.
- **Notable Trend**: The shift from steep to shallow slopes in the right diagram suggests damping or stabilization of the system under modified conditions. The preserved intersection at h=0, ε=0 indicates a conserved symmetry or invariant in the model.
## [Chart/Diagram Type]: Phase Diagram: ε₊ vs. ε₋ vs. h