\n
## Bar Charts: LLM Call Performance Across Datasets
### Overview
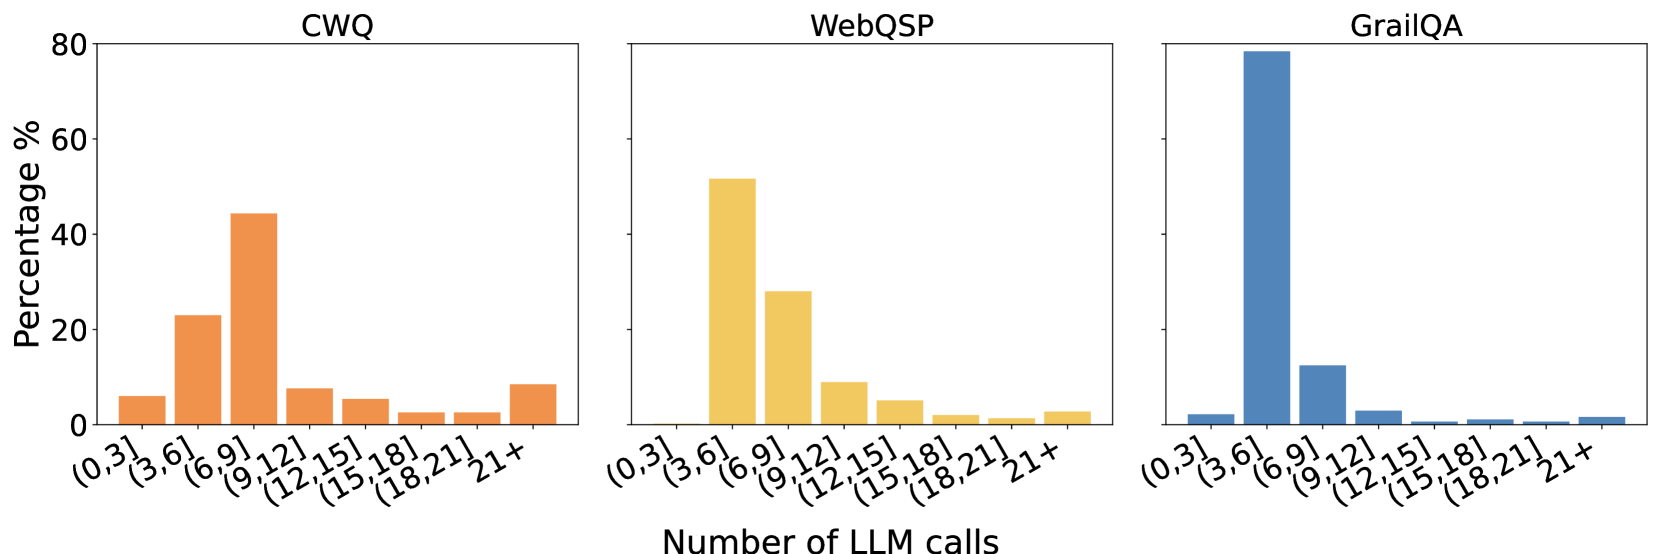
The image presents three bar charts, each representing the distribution of the number of Large Language Model (LLM) calls required to answer questions from different datasets: CWQ, WebQSP, and GrailQA. The y-axis represents the percentage of questions answered within a given number of LLM calls, while the x-axis categorizes the number of LLM calls into bins.
### Components/Axes
* **X-axis Title:** "Number of LLM calls"
* **Y-axis Title:** "Percentage %"
* **Datasets (Chart Titles):** CWQ, WebQSP, GrailQA
* **X-axis Categories:** (0, 3], (3, 6], (6, 9], (9, 12], (12, 15], (15, 18], (18, 21], 21+
* **Color Scheme:**
* CWQ: Orange
* WebQSP: Yellow-Orange
* GrailQA: Blue
### Detailed Analysis
**CWQ (Left Chart):**
The distribution peaks in the (3, 6] call range. The trend is a decreasing frequency as the number of LLM calls increases.
* (0, 3]: Approximately 8%
* (3, 6]: Approximately 42%
* (6, 9]: Approximately 25%
* (9, 12]: Approximately 12%
* (12, 15]: Approximately 6%
* (15, 18]: Approximately 4%
* (18, 21]: Approximately 2%
* 21+: Approximately 1%
**WebQSP (Center Chart):**
The distribution peaks in the (6, 9] call range. The trend is a decreasing frequency as the number of LLM calls increases.
* (0, 3]: Approximately 10%
* (3, 6]: Approximately 25%
* (6, 9]: Approximately 45%
* (9, 12]: Approximately 10%
* (12, 15]: Approximately 5%
* (15, 18]: Approximately 3%
* (18, 21]: Approximately 1%
* 21+: Approximately 1%
**GrailQA (Right Chart):**
The distribution peaks in the (9, 12] call range. The trend is a decreasing frequency as the number of LLM calls increases.
* (0, 3]: Approximately 5%
* (3, 6]: Approximately 15%
* (6, 9]: Approximately 20%
* (9, 12]: Approximately 70%
* (12, 15]: Approximately 5%
* (15, 18]: Approximately 2%
* (18, 21]: Approximately 1%
* 21+: Approximately 2%
### Key Observations
* CWQ generally requires fewer LLM calls than WebQSP and GrailQA.
* GrailQA has a very strong peak at 9-12 LLM calls, indicating that most questions can be answered within this range.
* WebQSP shows a broader distribution, suggesting more variability in the complexity of questions.
* The percentage of questions requiring 21+ LLM calls is consistently low across all datasets.
### Interpretation
The data suggests that the difficulty of answering questions varies significantly across the three datasets. GrailQA appears to be the most amenable to LLM-based question answering, with a large proportion of questions resolved within a relatively small number of calls. CWQ is also relatively efficient, while WebQSP requires a more extensive search process, as evidenced by its broader distribution. The low percentage of questions requiring a very large number of LLM calls (21+) across all datasets indicates that the LLM is generally able to converge on an answer within a reasonable number of iterations. This could be due to the quality of the LLM, the nature of the datasets, or a combination of both. The differences in distributions likely reflect the inherent complexity and characteristics of each dataset – for example, the type of questions asked, the depth of knowledge required, and the ambiguity of the language used.