## Bar Charts: LLM Call Distribution Across Three Datasets
### Overview
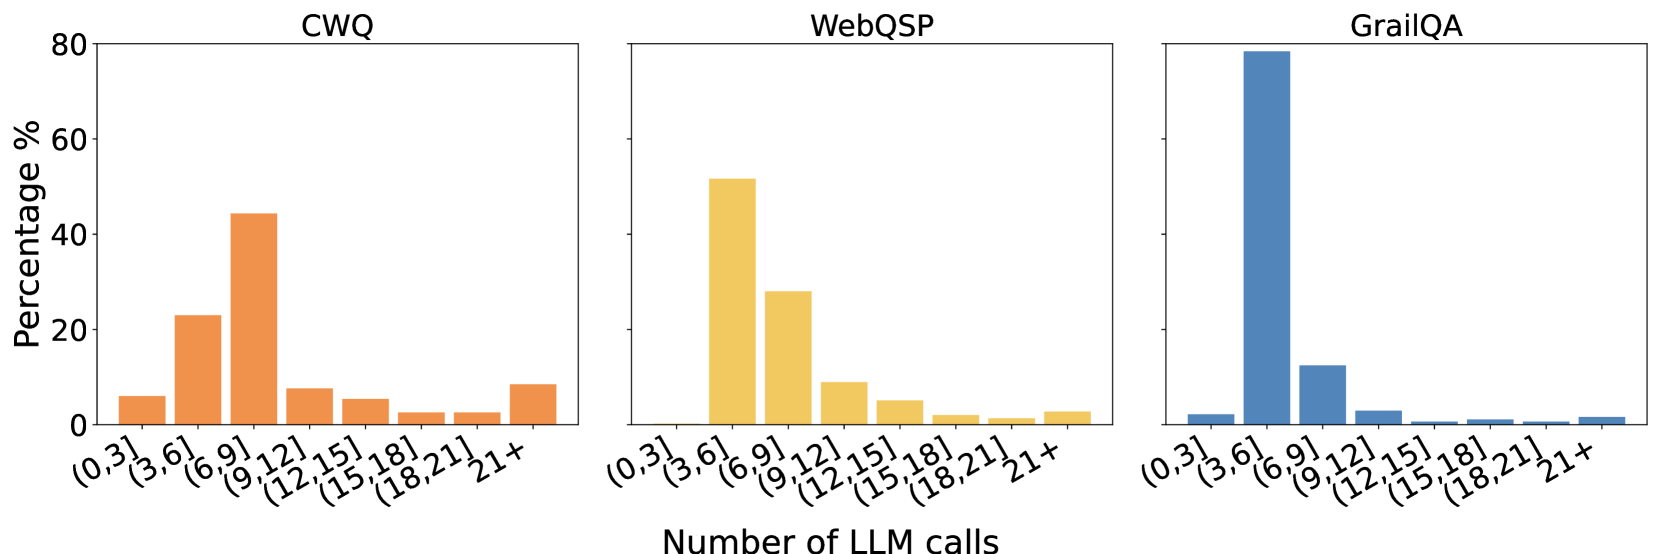
The image contains three side-by-side bar charts comparing the distribution of LLM (Large Language Model) calls across three datasets: CWQ (orange), WebQSP (yellow), and GrailQA (blue). Each chart shows the percentage of queries falling into specific ranges of LLM call counts, with the x-axis representing call count ranges and the y-axis showing percentages.
### Components/Axes
- **X-axis**: Number of LLM calls in ranges:
`(0,3]`, `(3,6]`, `(6,9]`, `(9,12]`, `(12,15]`, `(15,18]`, `(18,21]`, `21+`
- **Y-axis**: Percentage (%) of queries in each range
- **Legends**:
- Top-left: CWQ (orange)
- Top-center: WebQSP (yellow)
- Top-right: GrailQA (blue)
### Detailed Analysis
#### CWQ (Orange)
- `(0,3]`: ~5%
- `(3,6]`: ~25%
- `(6,9]`: ~45% (peak)
- `(9,12]`: ~8%
- `(12,15]`: ~5%
- `(15,18]`: ~2%
- `(18,21]`: ~2%
- `21+`: ~8%
#### WebQSP (Yellow)
- `(0,3]`: 0%
- `(3,6]`: ~50% (peak)
- `(6,9]`: ~30%
- `(9,12]`: ~10%
- `(12,15]`: ~5%
- `(15,18]`: ~2%
- `(18,21]`: ~1%
- `21+`: ~2%
#### GrailQA (Blue)
- `(0,3]`: ~2%
- `(3,6]`: ~15%
- `(6,9]`: ~80% (peak)
- `(9,12]`: ~3%
- `(15,18]`: ~1%
- `(18,21]`: ~1%
- `21+`: ~2%
### Key Observations
1. **GrailQA Dominance**: GrailQA has an extreme concentration of queries in the `(6,9]` range (~80%), far exceeding the other datasets.
2. **CWQ vs. WebQSP**:
- CWQ peaks at `(6,9]` (~45%) but has a broader distribution.
- WebQSP peaks at `(3,6]` (~50%) with a sharper drop-off.
3. **Long-Tail Behavior**: All datasets show minimal usage in the `21+` range (<5%), indicating most queries are resolved within 9 calls.
4. **GrailQA Anomaly**: The `(6,9]` range for GrailQA is 3–4x higher than CWQ and 5x higher than WebQSP, suggesting a unique query pattern or model behavior.
### Interpretation
The data suggests significant differences in query complexity or model efficiency across datasets:
- **GrailQA** likely handles highly complex or multi-step queries requiring 6–9 LLM calls for ~80% of cases.
- **WebQSP** favors simpler queries resolved in 3–6 calls (~80% of its distribution).
- **CWQ** exhibits a middle ground, with moderate complexity queries (6–9 calls) being most common.
The near-absence of `21+` calls across all datasets implies robust query resolution mechanisms, though GrailQA’s extreme peak may indicate either specialized use cases or potential inefficiencies in handling edge cases. The stark contrast between datasets highlights the need for dataset-specific optimization strategies.