## Memristor Characteristics: Volatile vs. Non-Volatile
### Overview
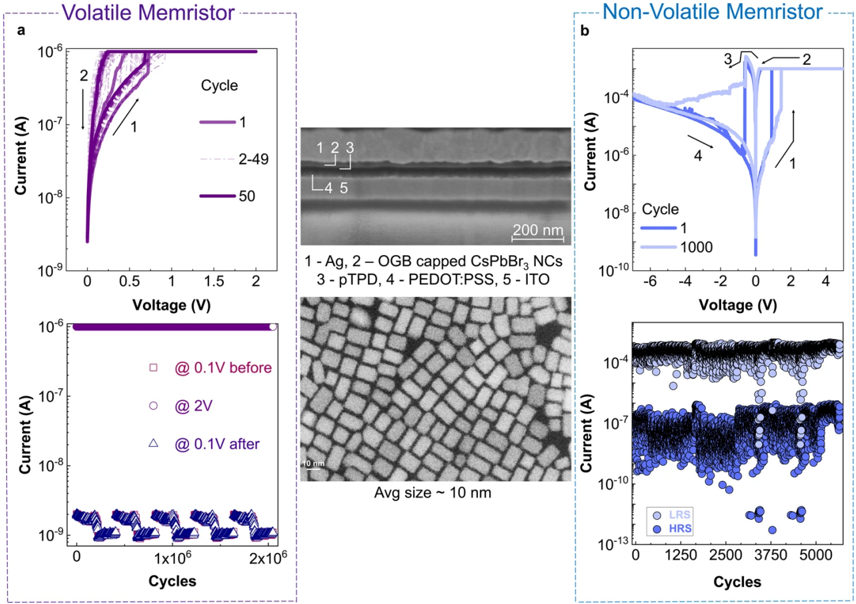
The image presents a comparative analysis of volatile and non-volatile memristor characteristics. It includes current-voltage (I-V) curves, cycling endurance plots, and material structure images for both types of memristors. The volatile memristor data is on the left (labeled 'a'), and the non-volatile memristor data is on the right (labeled 'b').
### Components/Axes
**Volatile Memristor (Left Side - 'a')**
* **Top Chart:** I-V Curve
* Y-axis: Current (A), logarithmic scale from 10^-9 to 10^-6
* X-axis: Voltage (V), linear scale from 0 to 2
* Legend (top-right):
* Cycle 1 (purple solid line)
* Cycle 2-49 (gray dashed line)
* Cycle 50 (dark purple solid line)
* **Bottom Chart:** Cycling Endurance
* Y-axis: Current (A), logarithmic scale from 10^-9 to 10^-6
* X-axis: Cycles, linear scale from 0 to 2x10^6
* Legend (center):
* Square: @ 0.1V before
* Circle: @ 2V
* Triangle: @ 0.1V after
* **Middle Images:**
* Top: Cross-sectional TEM image with labels 1-5. Scale bar: 200 nm.
* Bottom: Top-down TEM image. Average size ~ 10 nm.
* Labels:
* 1 - Ag
* 2 - OGB capped CsPbBr3 NCs
* 3 - pTPD
* 4 - PEDOT:PSS
* 5 - ITO
**Non-Volatile Memristor (Right Side - 'b')**
* **Top Chart:** I-V Curve
* Y-axis: Current (A), logarithmic scale from 10^-10 to 10^-4
* X-axis: Voltage (V), linear scale from -6 to 4
* Legend (top-right):
* Cycle 1 (light blue solid line)
* Cycle 1000 (dark blue solid line)
* **Bottom Chart:** Cycling Endurance
* Y-axis: Current (A), logarithmic scale from 10^-13 to 10^-4
* X-axis: Cycles, linear scale from 0 to 5000
* Legend (bottom-left):
* LRS (light blue circles)
* HRS (dark blue circles)
### Detailed Analysis
**Volatile Memristor (Left Side - 'a')**
* **Top Chart (I-V Curve):**
* Cycle 1: Current increases sharply around 0.1V to approximately 10^-6 A, then decreases as voltage increases to 2V.
* Cycles 2-49: Similar behavior to Cycle 1, but with slightly lower current levels.
* Cycle 50: Similar behavior to Cycle 1, but with slightly higher current levels.
* **Bottom Chart (Cycling Endurance):**
* @ 0.1V before: Current remains consistently high at approximately 10^-6 A across all cycles.
* @ 2V: Current fluctuates between approximately 10^-9 A and 10^-8 A, showing switching behavior.
* @ 0.1V after: Current fluctuates between approximately 10^-9 A and 10^-8 A, showing switching behavior.
**Non-Volatile Memristor (Right Side - 'b')**
* **Top Chart (I-V Curve):**
* Cycle 1: Current starts low, increases around 2V to approximately 10^-4 A, then decreases as voltage increases to 4V. As voltage decreases from 4V to -6V, the current decreases.
* Cycle 1000: Shows a more defined hysteresis loop compared to Cycle 1. The switching occurs at different voltage levels.
* **Bottom Chart (Cycling Endurance):**
* LRS (Low Resistance State): Current fluctuates around 10^-7 A.
* HRS (High Resistance State): Current fluctuates around 10^-4 A.
### Key Observations
* **Volatile Memristor:** Exhibits a clear switching behavior in the I-V curve, with the current returning to a low state after the voltage is removed. The cycling endurance plot shows a stable high current state at 0.1V before switching, and fluctuating low current states at 2V and 0.1V after switching.
* **Non-Volatile Memristor:** Shows a distinct hysteresis loop in the I-V curve, indicating non-volatile memory behavior. The cycling endurance plot demonstrates a clear separation between the high resistance state (HRS) and low resistance state (LRS) over many cycles.
* **Material Structure:** The TEM images provide insights into the memristor's layered structure and the size of the nanocrystals.
### Interpretation
The data suggests that the volatile memristor exhibits temporary switching behavior, where the device returns to its original state after the voltage is removed. This is evident from the I-V curves and the cycling endurance plot. In contrast, the non-volatile memristor retains its state even after the voltage is removed, as indicated by the hysteresis loop and the distinct HRS and LRS levels in the cycling endurance plot. The TEM images provide structural context, showing the layered composition and nanocrystal size, which likely influence the memristor's performance. The difference in materials and structure likely contributes to the difference in volatile vs non-volatile behavior.