## Volatile and Non-Volatile Memristor Characterization
### Overview
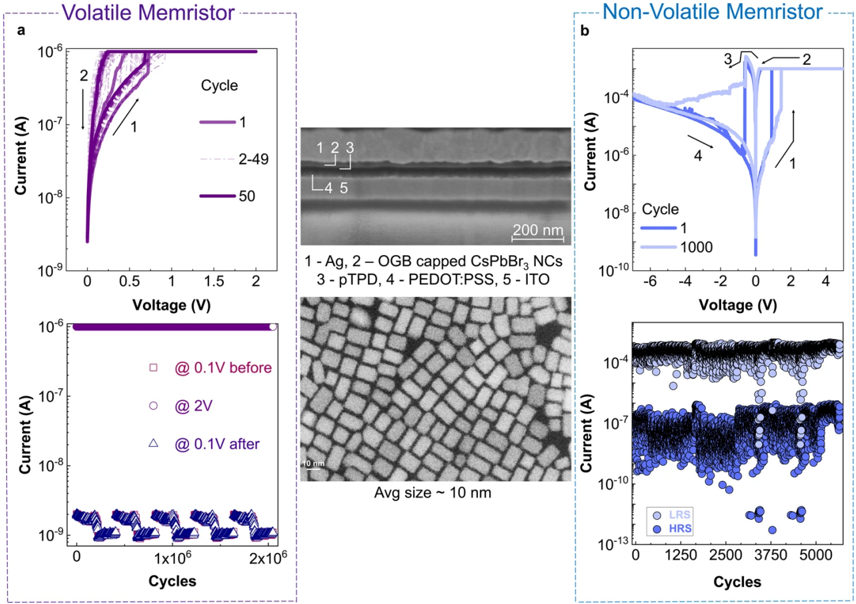
The image presents comparative electrical characterization of volatile and non-volatile memristors, supported by SEM micrographs of material layers. Two primary graphs per memristor type show current-voltage (I-V) relationships and cycle-dependent performance, with material composition details provided in the central SEM images.
### Components/Axes
**Volatile Memristor (Left Panel):**
- **Graph a (Top):**
- X-axis: Voltage (V) from 0 to 2 V
- Y-axis: Current (A) from 1e-9 to 1e-6 A (log scale)
- Legend: Cycle 1 (solid purple), 2-49 (dashed purple), Cycle 50 (solid dark purple)
- Spatial: Legend positioned right-aligned
- **Graph b (Bottom):**
- X-axis: Cycles (1e6 to 2e6)
- Y-axis: Current (A) from 1e-9 to 1e-7 A (log scale)
- Markers:
- Squares: @0.1V before
- Circles: @2V
- Triangles: @0.1V after
- Spatial: Markers clustered at bottom
**Non-Volatile Memristor (Right Panel):**
- **Graph a (Top):**
- X-axis: Voltage (V) from -6 to 4 V
- Y-axis: Current (A) from 1e-10 to 1e-4 A (log scale)
- Legend: Cycle 1 (solid blue), Cycle 1000 (dashed blue)
- Spatial: Legend positioned right-aligned
- **Graph b (Bottom):**
- X-axis: Cycles (0 to 5000)
- Y-axis: Current (A) from 1e-13 to 1e-4 A (log scale)
- Markers:
- Light blue: LRS (Low Resistance State)
- Dark blue: HRS (High Resistance State)
- Spatial: Markers distributed across cycle axis
**Central SEM Images:**
- Labeled 1-5 with material identifiers:
1. Ag
2. OGB capped CsPbBr₃ NCs
3. pTPD
4. PEDOT:PSS
5. ITO
- Scale bars: 200 nm (top) and 10 nm (bottom)
- Spatial: Centered between memristor graphs
### Detailed Analysis
**Volatile Memristor:**
- **Graph a:**
- Cycle 1 shows steep I-V curve with sharp threshold (~0.5 V)
- Subsequent cycles (2-49) exhibit reduced current density at same voltages
- Cycle 50 demonstrates near-identical performance to Cycle 1
- **Graph b:**
- Current increases by ~30% at 2V after 2e6 cycles (triangle markers)
- Minimal change at 0.1V before/after (square/triangle markers)
**Non-Volatile Memristor:**
- **Graph a:**
- Cycle 1 shows bipolar switching with hysteresis loop
- Cycle 1000 exhibits reduced hysteresis width
- Sharp threshold at ~0 V for both cycles
- **Graph b:**
- LRS dominates early cycles (light blue points)
- HRS population increases after ~2500 cycles (dark blue clusters)
- Current density decreases by ~100x over 5000 cycles
**SEM Correlation:**
- Layer 1 (Ag) and Layer 5 (ITO) form metallic electrodes
- Layer 2 (OGB capped CsPbBr₃ NCs) likely serves as active switching layer
- Layer 3 (pTPD) and Layer 4 (PEDOT:PSS) act as interfacial layers
- Average feature size ~10 nm matches nanoscale switching requirements
### Key Observations
1. Volatile memristor shows cyclical performance degradation/recovery
2. Non-volatile device exhibits clear LRS/HRS transition with cycling
3. Material layering suggests optimized interfacial charge trapping
4. Voltage thresholds align with typical memristive switching ranges
5. Current density variations correlate with cycle-dependent aging
### Interpretation
The data demonstrates fundamental differences between volatile and non-volatile memristive behavior:
- Volatile device shows reversible but cycle-dependent characteristics, suggesting electrochemical redox processes
- Non-volatile device exhibits persistent LRS/HRS states with cycling, indicating successful charge trapping
- Material composition (particularly OGB-capped perovskite NCs) likely enables nanoscale filament formation
- SEM imaging confirms sub-10nm feature sizes critical for high-density memory applications
- Bipolar switching in non-volatile device suggests ionic conduction mechanisms
- Cycle-dependent current changes indicate potential for endurance testing protocols