## Line Graph: Current vs. Time for LRS and HRS Systems
### Overview
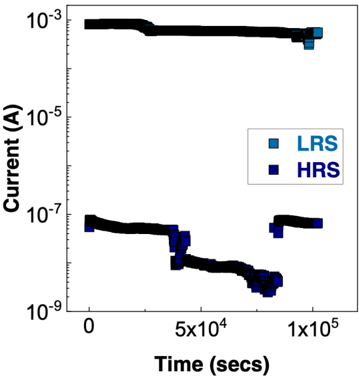
The image is a line graph comparing the current (in amperes) of two systems, LRS (Low Resistance System) and HRS (High Resistance System), over time (in seconds). The y-axis uses a logarithmic scale (10⁻³ to 10⁻⁹ A), while the x-axis is linear (0 to 1×10⁵ seconds). Two data series are plotted: LRS (blue squares with a black line) and HRS (dark blue squares with a dark blue line). The legend is positioned in the top-right corner.
---
### Components/Axes
- **X-axis (Time)**: Labeled "Time (secs)" with tick marks at 0, 5×10⁴, and 1×10⁵ seconds. The scale is linear.
- **Y-axis (Current)**: Labeled "Current (A)" with logarithmic ticks at 10⁻³, 10⁻⁵, 10⁻⁷, and 10⁻⁹ A.
- **Legend**: Located in the top-right corner, with:
- **LRS**: Blue squares (black line).
- **HRS**: Dark blue squares (dark blue line).
---
### Detailed Analysis
#### LRS (Low Resistance System)
- **Trend**: The current decreases monotonically over time.
- At **0 seconds**: ~1×10⁻³ A (1 mA).
- At **5×10⁴ seconds**: ~1×10⁻⁵ A (10 µA).
- At **1×10⁵ seconds**: ~1×10⁻⁷ A (0.1 µA).
- **Behavior**: A gradual decline with a sharp drop between 5×10⁴ and 1×10⁵ seconds.
#### HRS (High Resistance System)
- **Trend**: The current decreases sharply initially, then slightly increases.
- At **0 seconds**: ~1×10⁻⁷ A (0.1 µA).
- At **5×10⁴ seconds**: ~1×10⁻⁹ A (1 nA).
- At **1×10⁵ seconds**: ~1×10⁻⁸ A (10 nA).
- **Behavior**: A steep drop followed by a minor recovery.
---
### Key Observations
1. **LRS vs. HRS Initial Values**: LRS starts at a significantly higher current (~1 mA) compared to HRS (~0.1 µA).
2. **Rate of Decline**: HRS experiences a more abrupt drop in current (from 0.1 µA to 1 nA) compared to LRS (from 1 mA to 10 µA).
3. **Recovery in HRS**: HRS shows a slight increase in current (~10 nA) at the end of the observed period, unlike LRS, which continues to decline.
4. **Logarithmic Scale Impact**: The y-axis compression emphasizes the relative magnitude differences between LRS and HRS currents.
---
### Interpretation
- **System Behavior**:
- LRS likely represents a system with a higher initial current that decays over time, possibly due to resistive losses or thermal effects.
- HRS starts with a lower current but exhibits a more pronounced decay, followed by a minor recovery. This could indicate a secondary process (e.g., reactivation, hysteresis, or external stimulation) after a critical threshold (5×10⁴ seconds).
- **Potential Applications**:
- The data might relate to electrical systems, such as resistive heating elements, sensors, or energy storage devices, where LRS and HRS could correspond to different operational modes or materials.
- The recovery in HRS suggests a non-linear response, possibly due to feedback mechanisms or material properties (e.g., phase changes, electrochemical reactions).
- **Anomalies**:
- The sharp drop in HRS at 5×10⁴ seconds may indicate a failure, threshold event, or transition to a different operational state.
- The slight increase in HRS at 1×10⁵ seconds could signal a stabilization or external intervention.
---
### Spatial Grounding
- **Legend**: Top-right corner, clearly associating colors with data series.
- **Data Points**: LRS (blue squares) and HRS (dark blue squares) are distinct, with no overlap in marker colors.
- **Axis Labels**: Positioned at the bottom (x-axis) and left (y-axis), with logarithmic scaling on the y-axis.
---
### Content Details
- **Numerical Values**:
- LRS: 1×10⁻³ A → 1×10⁻⁵ A → 1×10⁻⁷ A.
- HRS: 1×10⁻⁷ A → 1×10⁻⁹ A → 1×10⁻⁸ A.
- **Trends**: Both systems show decay, but HRS has a non-monotonic trend with a recovery phase.
---
### Final Notes
The graph highlights contrasting dynamics between LRS and HRS, with LRS exhibiting a steady decline and HRS showing a sharp drop followed by a partial recovery. The logarithmic y-axis underscores the vast difference in current magnitudes, while the linear x-axis emphasizes the time-dependent evolution of these systems. Further investigation into the underlying physics (e.g., material properties, external stimuli) would clarify the mechanisms driving these trends.