\n
## Diagram: Logical System Flow
### Overview
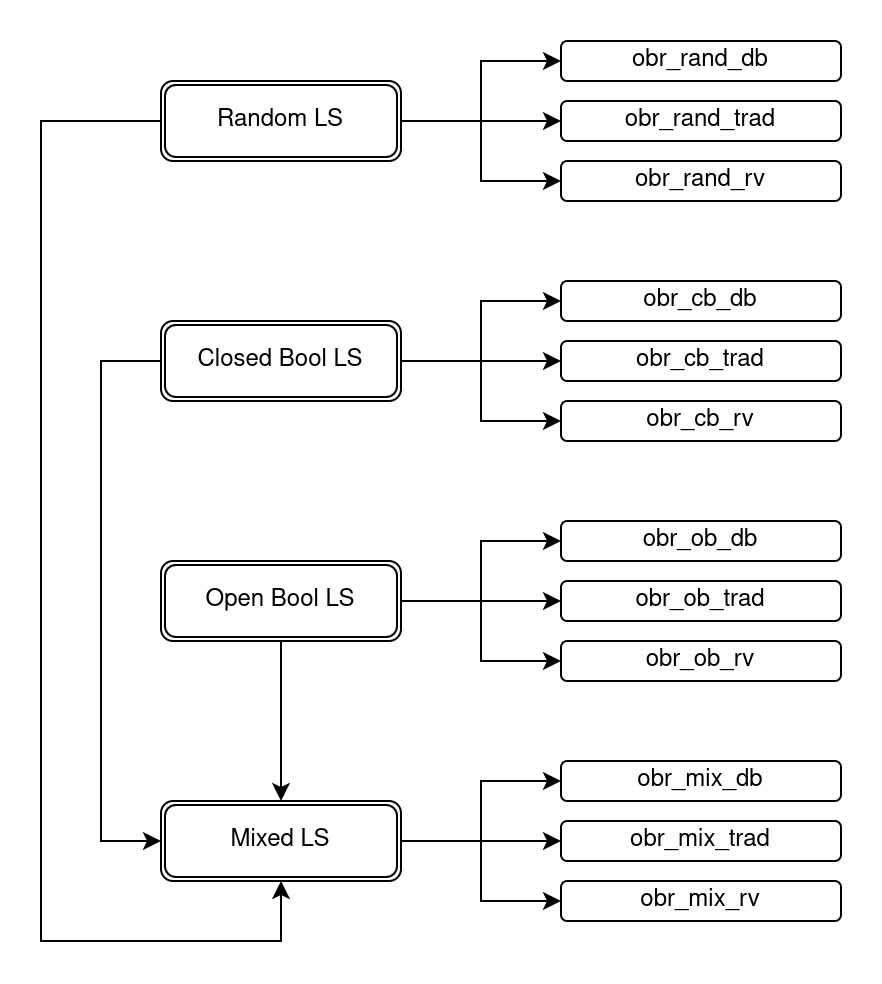
The image depicts a flow diagram illustrating the relationships between different Logical Systems (LS) and their corresponding observation outputs. The diagram shows a hierarchical structure with "Random LS", "Closed Bool LS", "Open Bool LS", and "Mixed LS" as central nodes, each feeding into three observation outputs. Arrows indicate the direction of flow from the LS to the observations.
### Components/Axes
The diagram consists of four main blocks representing Logical Systems:
1. Random LS
2. Closed Bool LS
3. Open Bool LS
4. Mixed LS
Each of these LS blocks connects to three observation blocks via arrows:
1. `obr_[LS abbreviation]_db`
2. `obr_[LS abbreviation]_trad`
3. `obr_[LS abbreviation]_rv`
Where `[LS abbreviation]` is replaced by `rand`, `cb`, `ob`, or `mix` respectively.
### Detailed Analysis or Content Details
The diagram shows the following connections:
* **Random LS** flows into:
* `obr_rand_db`
* `obr_rand_trad`
* `obr_rand_rv`
* **Closed Bool LS** flows into:
* `obr_cb_db`
* `obr_cb_trad`
* `obr_cb_rv`
* **Open Bool LS** flows into:
* `obr_ob_db`
* `obr_ob_trad`
* `obr_ob_rv`
* **Mixed LS** receives input from "Random LS", "Closed Bool LS", and "Open Bool LS" and flows into:
* `obr_mix_db`
* `obr_mix_trad`
* `obr_mix_rv`
All blocks are rectangular with rounded corners. The arrows are unidirectional, indicating a one-way flow of information. The "Mixed LS" block is positioned at the bottom and receives input from the other three LS blocks.
### Key Observations
The "Mixed LS" appears to be a convergence point for the outputs of the other three LS. The naming convention for the observation outputs suggests that "db", "trad", and "rv" represent different types or methods of observation. The diagram does not provide any information about the nature of the Logical Systems or the observations themselves, only their relationships.
### Interpretation
This diagram likely represents a system where different logical approaches (Random, Closed Boolean, Open Boolean, and Mixed) are used to generate observations. The "Mixed LS" suggests a combined or integrated approach, potentially leveraging the strengths of the other three. The three observation types ("db", "trad", "rv") could represent different data formats, analysis techniques, or validation methods. The diagram is a high-level architectural overview and doesn't provide details about the internal workings of each LS or the specific meaning of the observations. It suggests a modular design where different LS can be combined to create a more comprehensive observation system. The diagram is a visual representation of a data flow or processing pipeline.