## Line Chart Grid: Jacobian Norm Evolution Across Neural Network Layers
### Overview
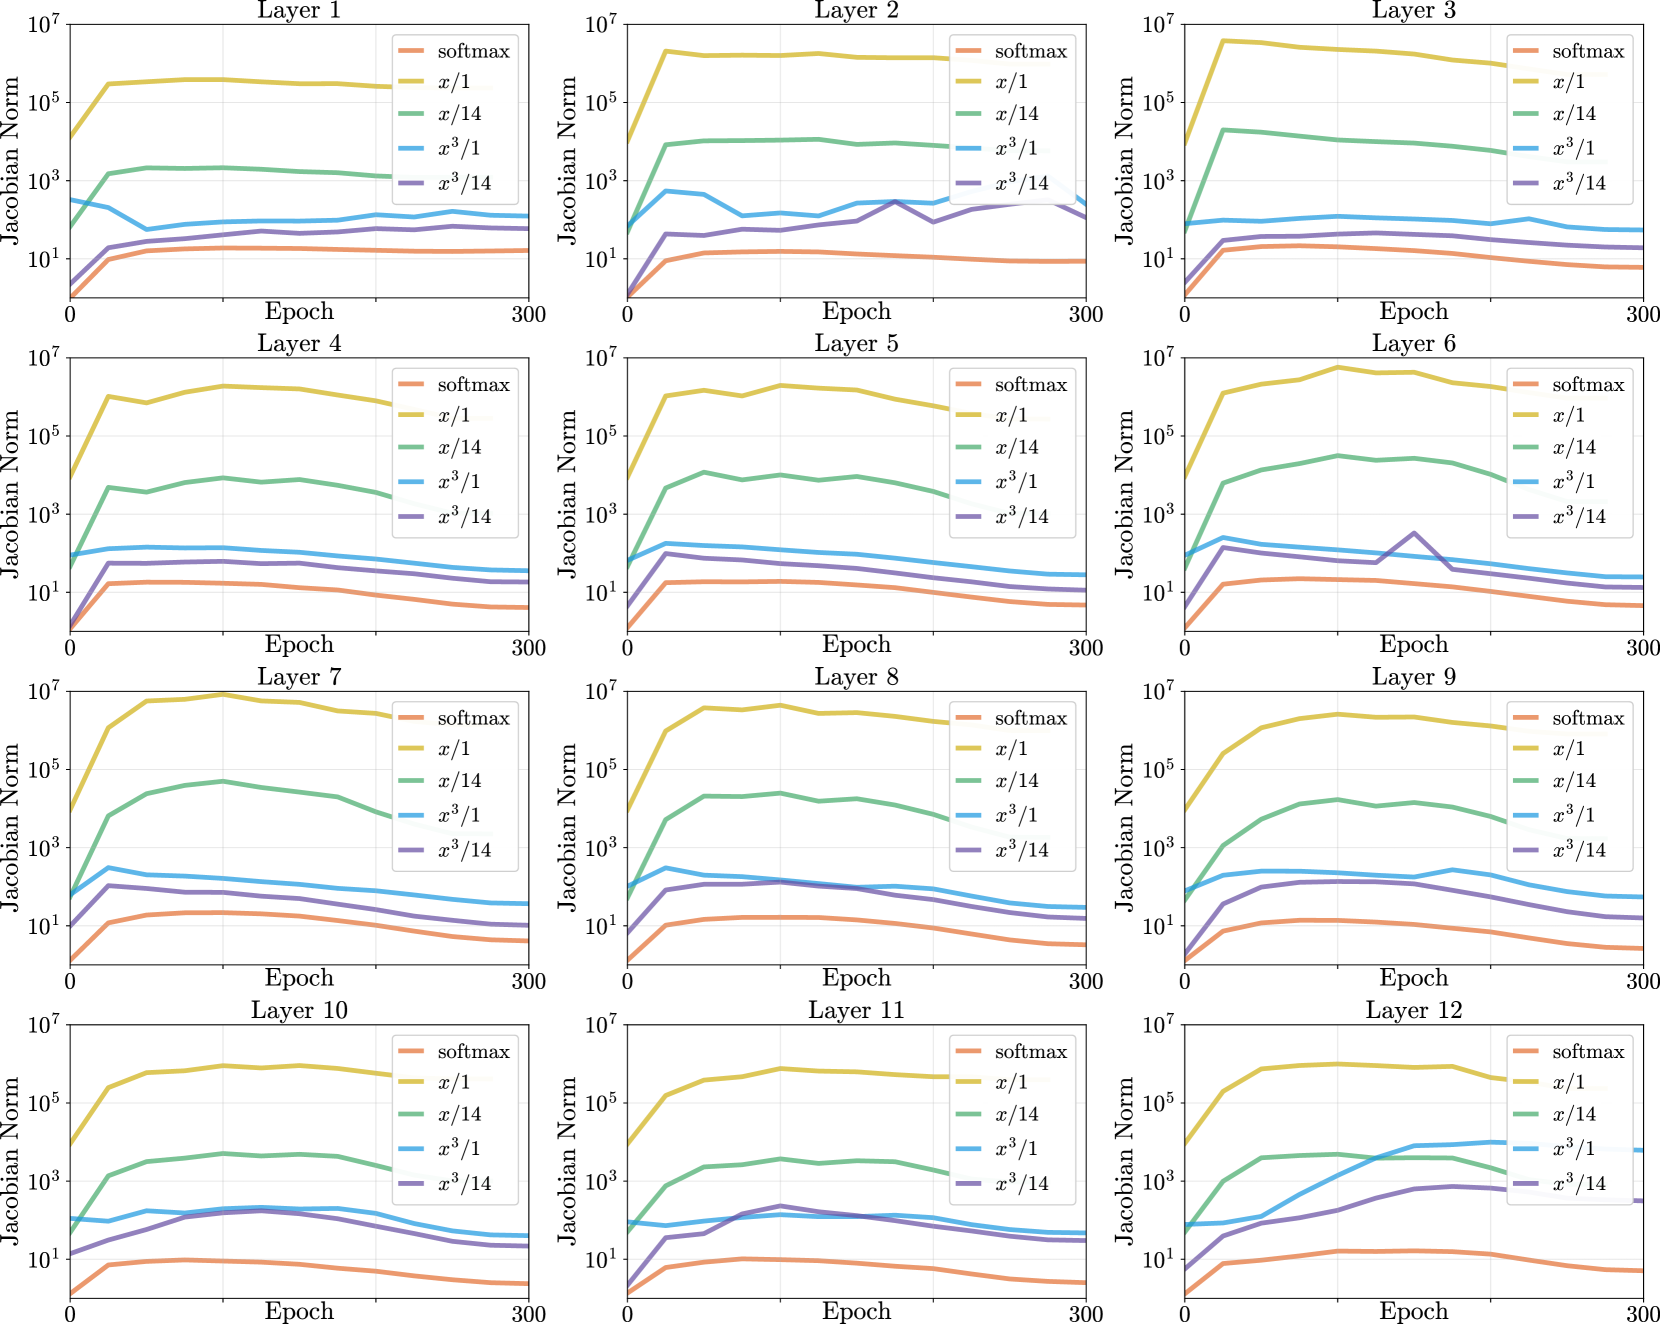
The image displays a 3x4 grid of line charts (12 total), each representing the evolution of Jacobian norm magnitudes across 300 training epochs for different neural network layers (Layer 1 to Layer 12). Each subplot compares five activation function variants: softmax, x/1, x/14, x³/1, and x³/14. All charts use logarithmic scales for both axes (Epoch: 0-300; Jacobian Norm: 10¹-10⁷).
### Components/Axes
- **X-axis**: Epoch (0-300), linear scale
- **Y-axis**: Jacobian Norm (10¹-10⁷), logarithmic scale
- **Legend**: Located in the top-right corner of each subplot, with color-coded labels:
- Orange: softmax
- Yellow: x/1
- Green: x/14
- Blue: x³/1
- Purple: x³/14
- **Subplot Structure**: Each layer (1-12) occupies a separate chart with identical axis ranges and legend positioning.
### Detailed Analysis
#### Layer 1-3 Trends
- **softmax (orange)**: Gradual decline from ~10¹ to ~10⁰.⁵ across all layers
- **x/1 (yellow)**: Sharp initial rise to ~10⁶, then plateau
- **x/14 (green)**: Moderate rise to ~10³, followed by stabilization
- **x³/1 (blue)**: Volatile fluctuations between 10¹-10³
- **x³/14 (purple)**: Steady decline from ~10¹ to ~10⁰.⁵
#### Layer 4-6 Trends
- **softmax (orange)**: Consistent downward trend to ~10⁰.⁵
- **x/1 (yellow)**: Maintains ~10⁶ plateau with minor oscillations
- **x/14 (green)**: Stable ~10³ with slight decay in later epochs
- **x³/1 (blue)**: Increased volatility in Layer 5 (peak ~10³.⁵)
- **x³/14 (purple)**: Layer 6 shows anomalous spike to ~10³ before decay
#### Layer 7-12 Trends
- **softmax (orange)**: Continued gradual decline to ~10⁰.⁵
- **x/1 (yellow)**: Sustained ~10⁶ with minor fluctuations
- **x/14 (green)**: Layer 10 shows increased stability (~10³)
- **x³/1 (blue)**: Layer 11 exhibits prolonged elevated values (~10³)
- **x³/14 (purple)**: Layer 12 demonstrates sharpest decay to ~10⁰.⁵
### Key Observations
1. **Activation Function Impact**:
- x/1 consistently produces highest Jacobian norms (~10⁶)
- softmax and x³/14 show strongest decay patterns
- x³/1 exhibits most volatility across layers
2. **Layer-Specific Anomalies**:
- Layer 2: x³/14 spike to ~10³ at epoch 150
- Layer 6: x³/14 temporary elevation to ~10³
- Layer 11: x³/1 maintains elevated values beyond other layers
3. **Scale Effects**:
- Logarithmic y-axis reveals exponential differences in magnitude
- x/1's dominance becomes visually apparent through consistent top placement
### Interpretation
The data suggests activation function choice significantly impacts gradient magnitude dynamics during training:
- **x/1**'s persistent high norms may indicate stronger gradient propagation but potential instability
- **softmax/x³/14**'s decay patterns suggest regularization effects or vanishing gradients
- Volatile x³/1 behavior could reflect sensitivity to initialization or layer depth
- Layer-specific anomalies (e.g., Layer 2/6 spikes) might correlate with architectural features or training dynamics
These patterns align with theoretical expectations: linear activations (x/1) maintain gradient strength, while non-linear variants (softmax, x³/14) introduce decay mechanisms. The x³/14's cubic scaling appears particularly effective at reducing gradient magnitudes across deeper layers.