# Technical Document Extraction: Blood Analysis Report (June 18, 1975)
## Document Metadata
* **Date:** June 18, 1975
* **Document Type:** Technical Research Summary / Data Table
* **Source:** Industry Documents Library (UCSF)
* **Language:** English
---
## 1. Header and Narrative Summary
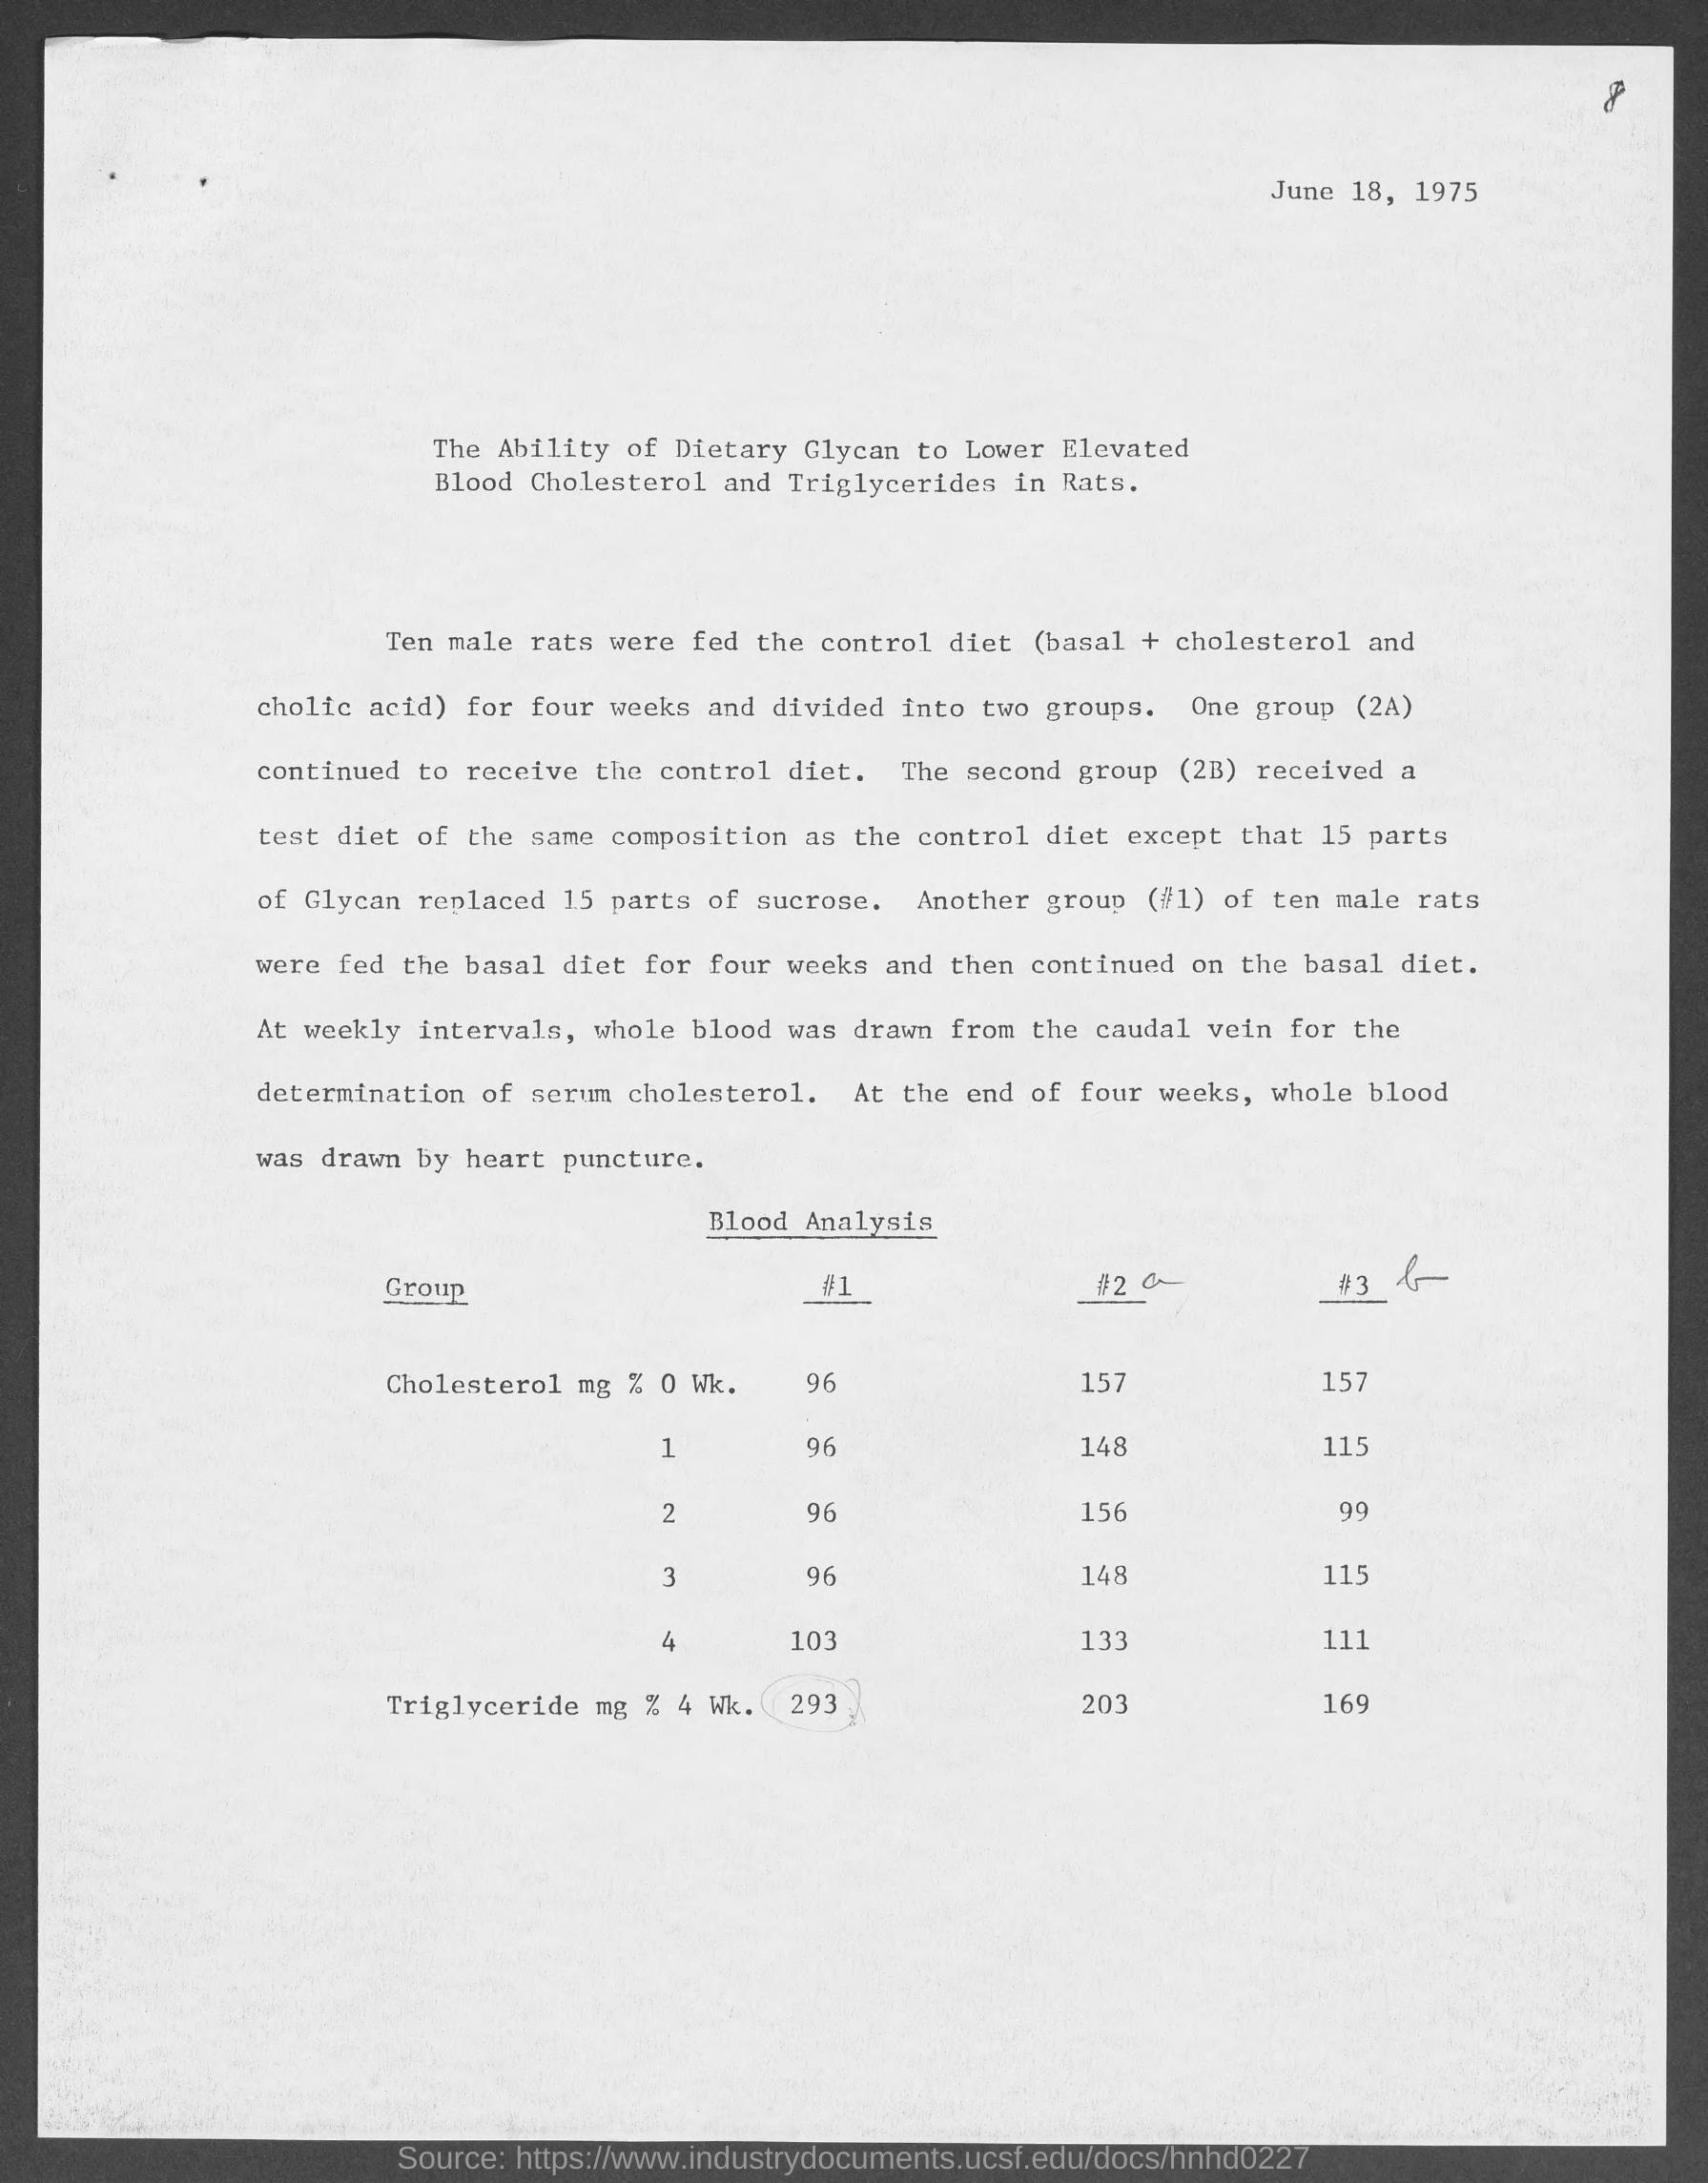
The document describes a study titled: **"The Ability of Dietary Glycan to Lower Elevated Blood Cholesterol and Triglycerides in Rats."**
### Experimental Methodology
The text describes an experiment involving male rats divided into specific dietary groups:
* **Initial Phase:** Ten male rats were fed a control diet (basal + cholesterol and cholic acid) for four weeks.
* **Group Division:**
* **Group 2A (Handwritten as #2 a):** Continued to receive the control diet.
* **Group 2B (Handwritten as #3 b):** Received a test diet where 15 parts of Glycan replaced 15 parts of sucrose.
* **Group #1:** A separate group of ten male rats fed a basal diet for four weeks and continued on that basal diet (Control/Baseline group).
* **Procedure:** Whole blood was drawn weekly from the caudal vein for serum cholesterol determination. At the end of four weeks, blood was drawn via heart puncture for final analysis.
---
## 2. Data Table: Blood Analysis
The following table reconstructs the data presented in the "Blood Analysis" section. Note that the column headers contain handwritten annotations modifying the original typed text.
| Measurement Category | Week | Group #1 (Basal) | Group #2 a (Control Diet) | Group #3 b (Glycan Test Diet) |
| :--- | :---: | :---: | :---: | :---: |
| **Cholesterol mg %** | 0 | 96 | 157 | 157 |
| | 1 | 96 | 148 | 115 |
| | 2 | 96 | 156 | 99 |
| | 3 | 96 | 148 | 115 |
| | 4 | 103 | 133 | 111 |
| **Triglyceride mg %** | 4 | 293* | 203 | 169 |
*\*Note: The value 293 for Group #1 Triglycerides is circled in the original document.*
---
## 3. Trend Analysis and Observations
### Cholesterol Trends
* **Group #1 (Basal Diet):** Remained extremely stable at 96 mg % for the first three weeks, with a slight increase to 103 mg % at week 4.
* **Group #2 a (Control Diet - High Cholesterol):** Started at a high baseline of 157 mg %. The levels fluctuated but remained elevated throughout the study, ending at 133 mg %.
* **Group #3 b (Glycan Test Diet):** Started at the same high baseline as Group 2 (157 mg %). There is a **sharp downward trend** immediately following the introduction of the Glycan diet. By Week 2, the level dropped to 99 mg % (nearly reaching the basal level of Group 1) before stabilizing in the 111-115 mg % range.
### Triglyceride Observations (Week 4)
* The Glycan Test Diet (Group #3 b) shows the lowest triglyceride levels (169 mg %) compared to the Control Diet (203 mg %).
* Interestingly, the Basal Diet group (#1) shows the highest triglyceride levels (293 mg %), which is highlighted by a hand-drawn circle in the source image.
---
## 4. Component Isolation & Annotations
* **Header:** Contains the date "June 18, 1975" in the top right and a handwritten "8" in the far top right corner.
* **Main Body:** Typed text explaining the experimental design.
* **Data Region:** A structured table under the underlined heading "Blood Analysis".
* **Handwritten Marks:**
* "a" added next to #2.
* "b" added next to #3.
* A circle around the value "293" in the Triglyceride row.
* **Footer:** Source URL watermark: `https://www.industrydocuments.ucsf.edu/docs/hnhd0227`