## Data Table: Blood Analysis of Rats Fed Different Diets
### Overview
This document presents a table summarizing the results of a study investigating the effect of dietary glycan on blood cholesterol and triglyceride levels in rats. The study involved three groups of rats fed different diets over a four-week period. The table displays the cholesterol and triglyceride levels measured at weeks 0 and 4 for each group.
### Components/Axes
The document consists of a title, introductory text describing the experimental setup, and a data table. The table has the following structure:
* **Column 1:** "Group" - Identifies the rat group (#1, #2, #3).
* **Column 2:** "Cholesterol mg % 0 Wk." - Cholesterol levels at week 0.
* **Column 3:** "Cholesterol mg % 1 Wk." - Cholesterol levels at week 1.
* **Column 4:** "Cholesterol mg % 2 Wk." - Cholesterol levels at week 2.
* **Column 5:** "Cholesterol mg % 3 Wk." - Cholesterol levels at week 3.
* **Column 6:** "Cholesterol mg % 4 Wk." - Cholesterol levels at week 4.
* **Column 7:** "Triglyceride mg % 4 Wk." - Triglyceride levels at week 4.
The document is dated June 18, 1975, and includes a source link at the bottom.
### Detailed Analysis or Content Details
**Introductory Text Transcription:**
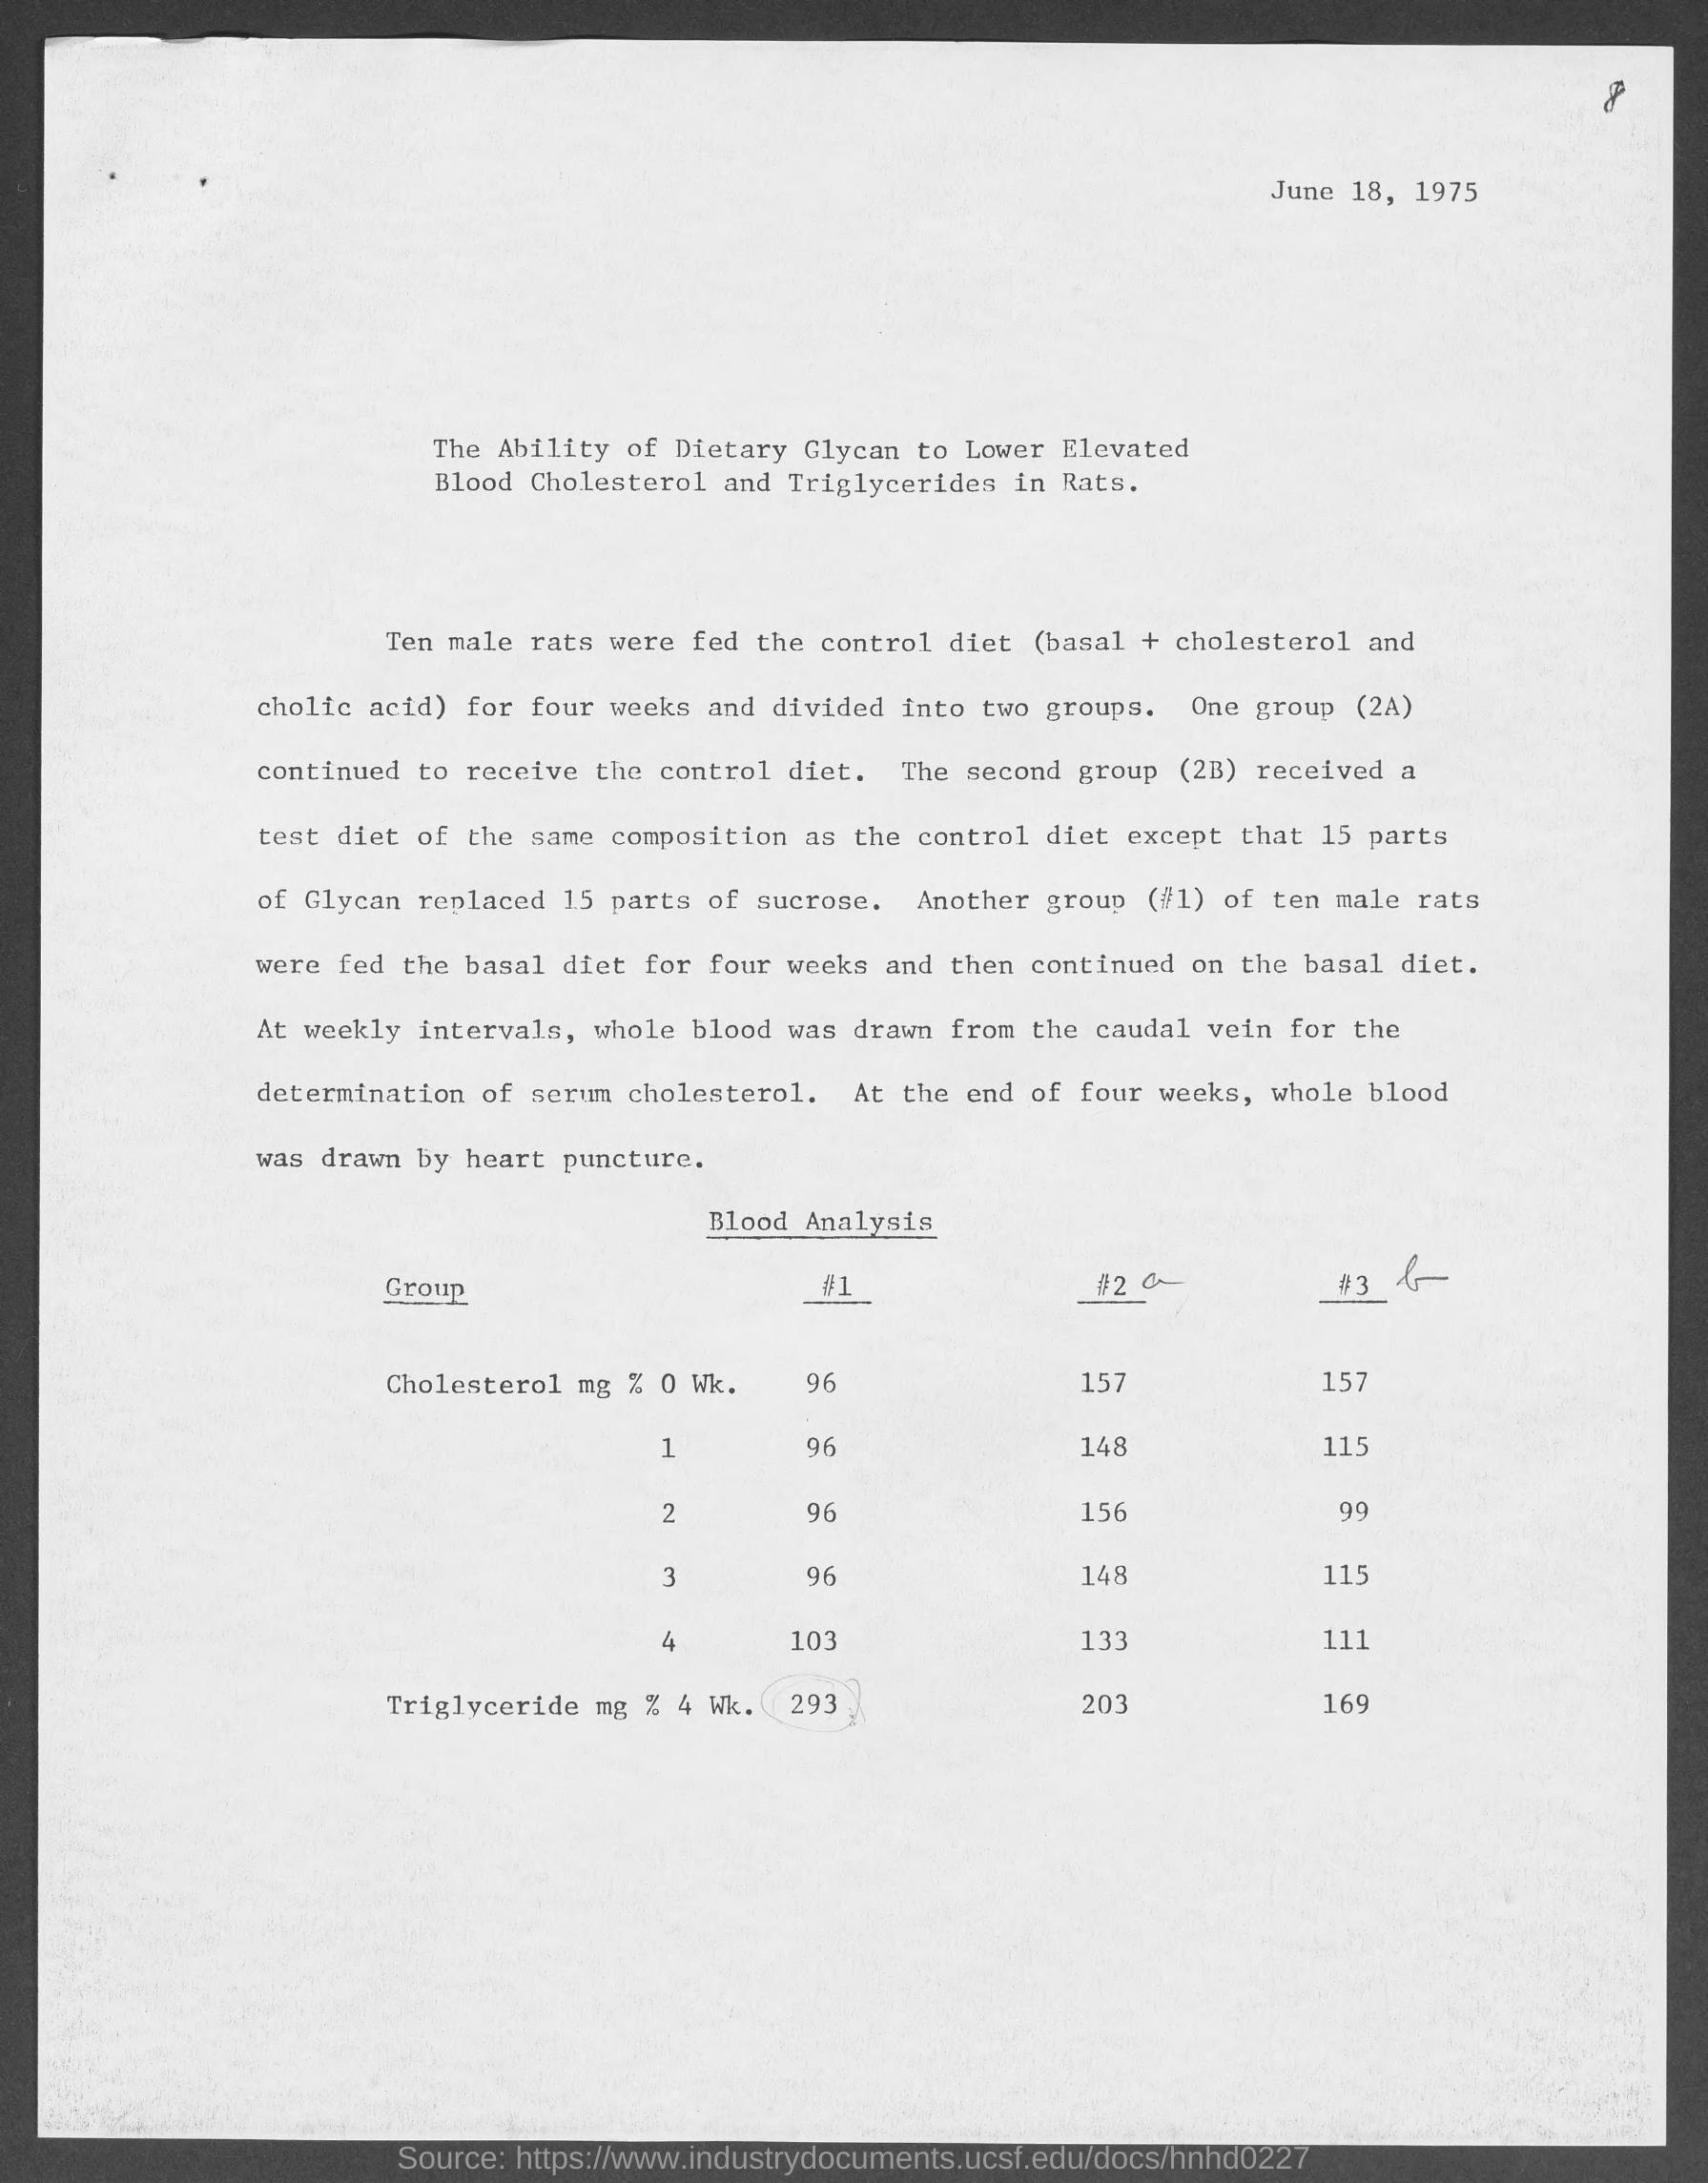
"The Ability of Dietary Glycan to Lower Elevated Blood Cholesterol and Triglycerides in Rats.
Ten male rats were fed the control diet (basal + cholesterol and cholic acid) for four weeks and divided into two groups. One group (2A) continued to receive the control diet. The second group (2B) received a test diet of the same composition as the control diet except that 15 parts of Glycan replaced 15 parts of sucrose. Another group (#1) of ten male rats were fed the basal diet for four weeks and then continued on the basal diet. At weekly intervals, whole blood was drawn from the caudal vein for the determination of serum cholesterol. At the end of four weeks, whole blood was drawn by heart puncture."
**Data Table Reconstruction:**
| Group | Cholesterol mg % 0 Wk. | Cholesterol mg % 1 Wk. | Cholesterol mg % 2 Wk. | Cholesterol mg % 3 Wk. | Cholesterol mg % 4 Wk. | Triglyceride mg % 4 Wk. |
|-------|------------------------|------------------------|------------------------|------------------------|------------------------|-------------------------|
| #1 | 96 | 96 | 96 | 96 | 103 | 293 |
| #2 | 157 | 148 | 156 | 148 | 133 | 203 |
| #3 | 157 | 115 | 99 | 115 | 111 | 169 |
### Key Observations
* **Group #1** shows a slight increase in cholesterol levels from week 0 to week 4 (96 to 103 mg%). Triglyceride levels are significantly higher in this group (293 mg%) compared to the other two groups.
* **Group #2** exhibits a decrease in cholesterol levels from week 0 to week 4 (157 to 133 mg%). Triglyceride levels are moderate (203 mg%).
* **Group #3** shows a substantial decrease in cholesterol levels from week 0 to week 4 (157 to 111 mg%). Triglyceride levels are the lowest among the three groups (169 mg%).
* The initial cholesterol levels (week 0) are notably different between the groups, with #1 starting at 96 mg%, while #2 and #3 start at 157 mg%.
### Interpretation
The data suggests that dietary glycan (as implemented in groups #2 and #3) may have a cholesterol-lowering effect in rats. Group #3, which experienced the most significant cholesterol reduction, also had the lowest triglyceride levels at week 4. This indicates a potential link between glycan consumption and improved lipid profiles.
The difference in initial cholesterol levels between the groups suggests that the rats were not randomly assigned to the diets, or that there were pre-existing differences in their cholesterol levels. Group #1, fed the basal diet, had the lowest initial cholesterol but the highest triglyceride levels, indicating that the basal diet may contribute to elevated triglycerides.
The study's design, dividing rats into groups receiving different diets (control, glycan-substituted, and basal), allows for a comparison of the effects of these diets on blood lipid levels. The weekly measurements provide insight into the temporal changes in cholesterol levels, while the final triglyceride measurement offers a snapshot of the overall lipid profile. The source link provided suggests this is part of a larger research effort.