\n
## Technical Document: Scientific Report with Data Table
### Overview
This image is a scanned page of a typed scientific report dated June 18, 1975. The document details an animal study investigating the effect of a dietary glycan on blood cholesterol and triglyceride levels in rats. It contains a descriptive paragraph outlining the experimental methodology and a data table titled "Blood Analysis" presenting the results. There are handwritten annotations on the table.
### Components/Axes
* **Document Header:** "June 18, 1975" (top right).
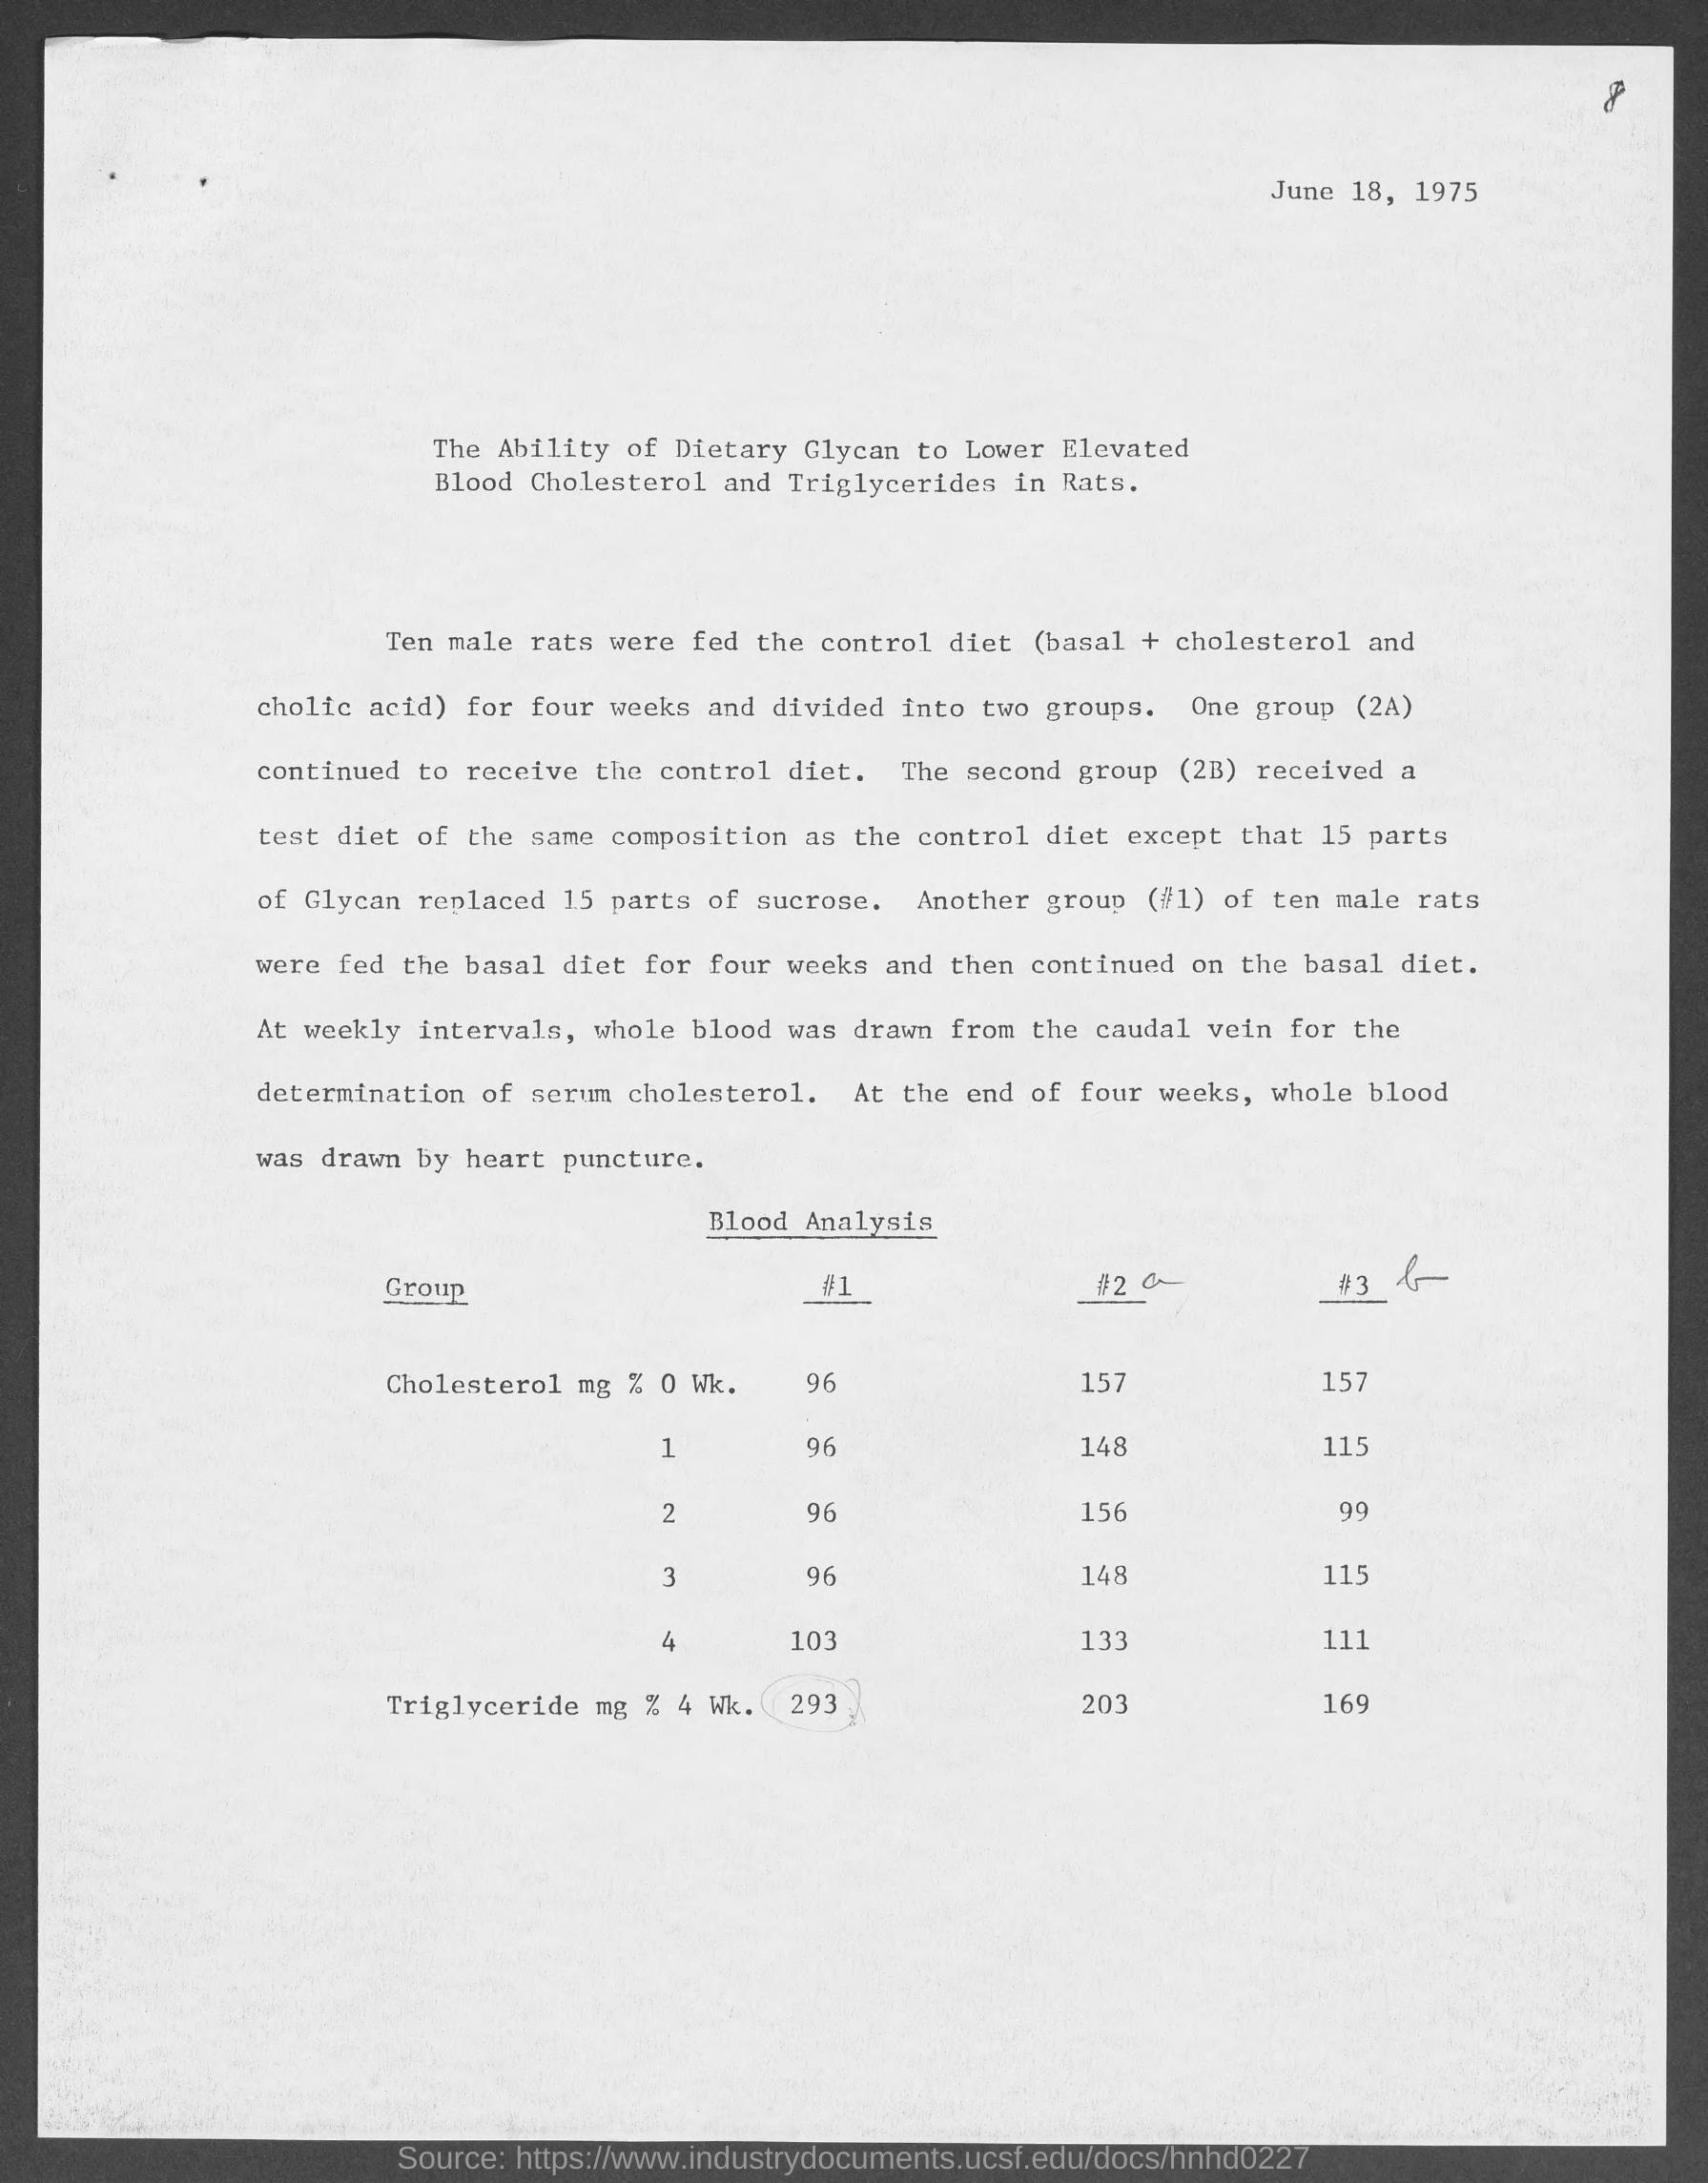
* **Title:** "The Ability of Dietary Glycan to Lower Elevated Blood Cholesterol and Triglycerides in Rats."
* **Methodology Paragraph:** Describes the experimental groups, diets, and blood sampling procedure.
* **Data Table:**
* **Title:** "Blood Analysis" (underlined).
* **Column Headers:** "Group", "#1", "#2a" (with a handwritten 'a'), "#3b" (with a handwritten 'b').
* **Row Labels:**
* "Cholesterol mg % 0 Wk."
* "1"
* "2"
* "3"
* "4"
* "Triglyceride mg % 4 Wk."
* **Source Watermark:** "Source: https://www.industrydocuments.ucsf.edu/docs/hnhd0227" (bottom margin).
### Detailed Analysis
**1. Transcription of Methodology Paragraph:**
"Ten male rats were fed the control diet (basal + cholesterol and cholic acid) for four weeks and divided into two groups. One group (2A) continued to receive the control diet. The second group (2B) received a test diet of the same composition as the control diet except that 15 parts of Glycan replaced 15 parts of sucrose. Another group (#1) of ten male rats were fed the basal diet for four weeks and then continued on the basal diet. At weekly intervals, whole blood was drawn from the caudal vein for the determination of serum cholesterol. At the end of four weeks, whole blood was drawn by heart puncture."
**2. Transcription and Reconstruction of Data Table:**
*Note: Handwritten annotations 'a' and 'b' are appended to the column headers #2 and #3, respectively. A circle is drawn around the value "293" in the Triglyceride row.*
| Group | #1 | #2a | #3b |
| :--- | :--- | :--- | :--- |
| **Cholesterol mg % 0 Wk.** | 96 | 157 | 157 |
| **1** | 96 | 148 | 115 |
| **2** | 96 | 156 | 99 |
| **3** | 96 | 148 | 115 |
| **4** | 103 | 133 | 111 |
| **Triglyceride mg % 4 Wk.** | **293** (circled) | 203 | 169 |
**3. Data Series Trends:**
* **Group #1 (Basal Diet):** Cholesterol levels are stable at 96 mg% for weeks 0-3, with a slight increase to 103 mg% at week 4. Triglycerides at week 4 are 293 mg%.
* **Group #2a (Control Diet - continued):** Cholesterol starts elevated at 157 mg%. It fluctuates slightly (148, 156, 148) before decreasing to 133 mg% at week 4. Triglycerides at week 4 are 203 mg%.
* **Group #3b (Glycan Test Diet):** Cholesterol starts elevated at 157 mg% (same as Group #2a). It shows a marked decrease to 115 mg% at week 1, drops further to 99 mg% at week 2, then rises slightly to 115 and 115 mg% in weeks 3 and 4. Triglycerides at week 4 are 169 mg%.
### Key Observations
1. **Baseline Disparity:** Groups #2a and #3b began the measured period (Week 0) with identical, elevated cholesterol levels (157 mg%), significantly higher than the basal diet group #1 (96 mg%). This confirms the initial "elevated" state mentioned in the title.
2. **Glycan Effect on Cholesterol:** Group #3b (Glycan) showed a rapid and substantial reduction in cholesterol from 157 mg% to 115 mg% within the first week, a 26.8% decrease. The level remained suppressed relative to its starting point and relative to Group #2a for the entire four-week period.
3. **Control Diet Trend:** Group #2a (Control) showed a much slower, modest decline in cholesterol over four weeks (from 157 to 133 mg%, a 15.3% decrease).
4. **Triglyceride Levels:** At the four-week endpoint, triglyceride levels were highest in the basal diet group (#1: 293 mg%), intermediate in the control diet group (#2a: 203 mg%), and lowest in the glycan diet group (#3b: 169 mg%).
5. **Handwritten Annotations:** The 'a' and 'b' on the column headers and the circle around the triglyceride value for Group #1 suggest this document was used for review or analysis, with specific attention drawn to the high triglyceride level in the basal diet group.
### Interpretation
The data suggests that the dietary glycan is effective in lowering elevated blood cholesterol in rats. The most compelling evidence is the rapid divergence between the glycan group (#3b) and the control group (#2a) after week 0, despite both starting from the same elevated baseline. The glycan intervention appears to have a more potent and immediate effect on cholesterol reduction than simply continuing the cholesterol-elevating control diet.
Furthermore, the glycan diet was associated with the lowest triglyceride levels at the study's end, indicating a potential broader lipid-lowering benefit. The high triglycerides in the basal diet group (#1) are an interesting outlier; this group was not on a cholesterol-elevating diet, yet had the highest triglycerides, which may reflect a specific metabolic response to the basal diet composition in this model.
The handwritten circle around the triglyceride value for Group #1 (293 mg%) highlights it as a point of interest, possibly indicating an unexpected or particularly significant result that warranted further investigation. Overall, the document provides clear, quantitative support for the hypothesis stated in its title.