# Technical Document Extraction: Timeline Diagram Analysis
## 1. Axis Labels and Titles
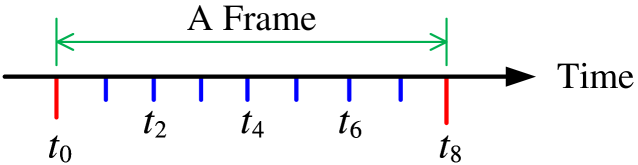
- **Horizontal Axis**: Labeled "Time" (direction: left-to-right).
- **Vertical Axis**: Labeled "A Frame" (direction: top-to-bottom).
## 2. Diagram Components
### A. Colored Vertical Lines
- **Red Lines**:
- Positioned at `t₀` (start) and `t₈` (end) on the Time axis.
- Purpose: Likely denote start/end of a process or event.
- **Blue Lines**:
- Positioned at `t₂`, `t₄`, and `t₆` on the Time axis.
- Purpose: Intermediate markers or checkpoints.
### B. Green Horizontal Line
- **Label**: "A Frame" (text embedded above the line).
- **Placement**: Spans from `t₀` to `t₈` across the Time axis.
- **Purpose**: Represents a fixed duration or reference frame.
## 3. Spatial Grounding
- **Legend**: Not explicitly present. Colors are directly mapped to elements:
- Red = Start/End markers.
- Blue = Intermediate markers.
- Green = Frame reference.
## 4. Trend Verification
- **Green Line ("A Frame")**: Constant horizontal line (no slope), indicating a fixed duration.
- **Red/Blue Lines**: Discrete vertical markers with no trend (static points in time).
## 5. Component Isolation
- **Header**: Axis labels ("Time" and "A Frame").
- **Main Chart**: Timeline with vertical markers and the green frame line.
- **Footer**: No additional elements.
## 6. Textual Transcription
- **Embedded Text**:
- "A Frame" (above the green line).
- Time markers: `t₀`, `t₂`, `t₄`, `t₆`, `t₈`.
## 7. Key Observations
- The diagram visualizes a timeline with discrete events (red/blue markers) and a persistent reference frame (green line).
- No numerical data or trends are present; the focus is on temporal segmentation and reference.
## 8. Missing Elements
- No data table, heatmap, or additional legends.
- No textual blocks beyond axis labels and embedded markers.
## Conclusion
This diagram represents a simplified timeline with key markers and a fixed reference frame. It lacks numerical data but emphasizes temporal segmentation and structural boundaries.