TECHNICAL ASSET FINGERPRINT
2604d4750b3fdb4f6332e00a
Click to view fullscreen
Press ESC or click to close
FOUND IN PAPERS
EXPERT: healer-alpha-free VERSION 1
RUNTIME: free/openrouter/healer-alpha
INTEL_VERIFIED
\n
## [Chart Type]: Multi-Panel Line Chart with Confidence Intervals
### Overview
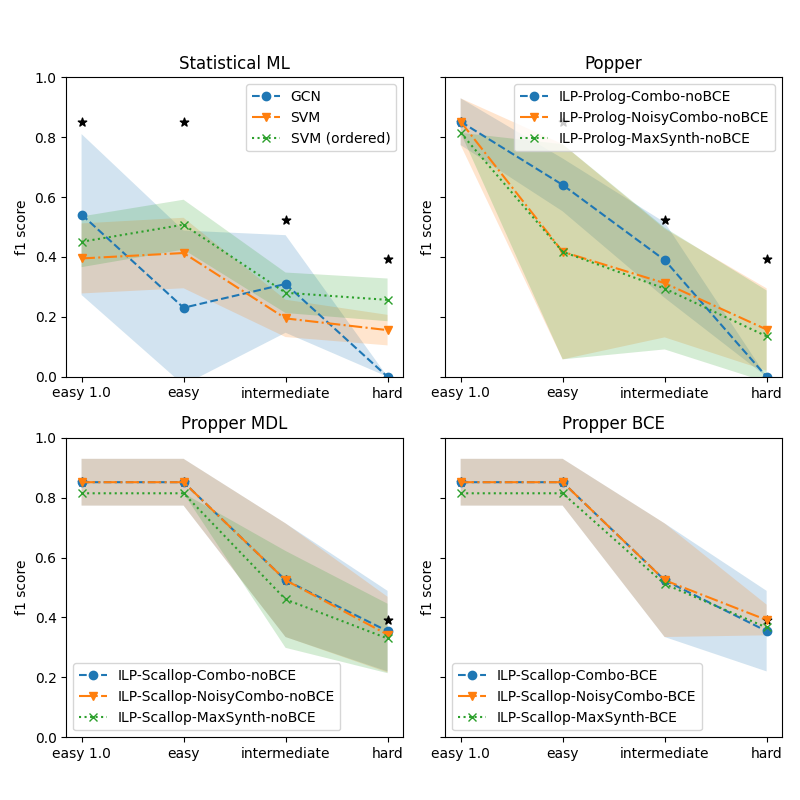
The image displays a 2x2 grid of four line charts, each comparing the performance (F1 score) of different machine learning or logic programming methods across four difficulty levels. The charts include shaded regions representing confidence intervals or variance. Black star markers appear at specific data points in each plot.
### Components/Axes
* **Overall Structure:** Four subplots arranged in a 2x2 grid.
* **Common Axes:**
* **X-axis (All plots):** Categorical labels representing task difficulty. From left to right: `easy 1.0`, `easy`, `intermediate`, `hard`.
* **Y-axis (All plots):** Labeled `f1 score`. Scale ranges from 0.0 to 1.0, with major ticks at 0.0, 0.2, 0.4, 0.6, 0.8, 1.0.
* **Subplot Titles (Top Center):**
1. Top-Left: `Statistical ML`
2. Top-Right: `Popper`
3. Bottom-Left: `Propper MDL`
4. Bottom-Right: `Propper BCE`
* **Legends:** Each subplot contains a legend box.
* **Statistical ML (Top-Left):** Legend is in the top-left corner. Contains:
* Blue circle with dashed line: `GCN`
* Orange triangle (down) with dash-dot line: `SVM`
* Green 'x' with dotted line: `SVM (ordered)`
* **Popper (Top-Right):** Legend is in the top-right corner. Contains:
* Blue circle with dashed line: `ILP-Prolog-Combo-noBCE`
* Orange triangle (down) with dash-dot line: `ILP-Prolog-NoisyCombo-noBCE`
* Green 'x' with dotted line: `ILP-Prolog-MaxSynth-noBCE`
* **Propper MDL (Bottom-Left):** Legend is in the bottom-left corner. Contains:
* Blue circle with dashed line: `ILP-Scallop-Combo-noBCE`
* Orange triangle (down) with dash-dot line: `ILP-Scallop-NoisyCombo-noBCE`
* Green 'x' with dotted line: `ILP-Scallop-MaxSynth-noBCE`
* **Propper BCE (Bottom-Right):** Legend is in the bottom-right corner. Contains:
* Blue circle with dashed line: `ILP-Scallop-Combo-BCE`
* Orange triangle (down) with dash-dot line: `ILP-Scallop-NoisyCombo-BCE`
* Green 'x' with dotted line: `ILP-Scallop-MaxSynth-BCE`
* **Other Visual Elements:**
* **Shaded Regions:** Each line has a semi-transparent shaded area of the same color, indicating confidence intervals or standard deviation.
* **Black Star Markers:** A black star (`★`) is plotted at specific (x, y) coordinates in each subplot, seemingly independent of the line series.
### Detailed Analysis
**1. Statistical ML (Top-Left)**
* **Trend Verification:** All three methods show a general downward trend in F1 score as difficulty increases from `easy 1.0` to `hard`.
* **Data Points (Approximate):**
* **GCN (Blue):** `easy 1.0`: ~0.55, `easy`: ~0.23, `intermediate`: ~0.31, `hard`: 0.0.
* **SVM (Orange):** `easy 1.0`: ~0.40, `easy`: ~0.41, `intermediate`: ~0.20, `hard`: ~0.16.
* **SVM (ordered) (Green):** `easy 1.0`: ~0.44, `easy`: ~0.50, `intermediate`: ~0.28, `hard`: ~0.25.
* **Black Stars:** Located at approximately (`easy 1.0`, 0.85), (`easy`, 0.85), (`intermediate`, 0.52), (`hard`, 0.40).
**2. Popper (Top-Right)**
* **Trend Verification:** All three ILP-Prolog methods start with high F1 scores at `easy 1.0` and show a steep, consistent decline as difficulty increases.
* **Data Points (Approximate):**
* **ILP-Prolog-Combo-noBCE (Blue):** `easy 1.0`: ~0.85, `easy`: ~0.64, `intermediate`: ~0.38, `hard`: 0.0.
* **ILP-Prolog-NoisyCombo-noBCE (Orange):** `easy 1.0`: ~0.85, `easy`: ~0.41, `intermediate`: ~0.31, `hard`: ~0.18.
* **ILP-Prolog-MaxSynth-noBCE (Green):** `easy 1.0`: ~0.80, `easy`: ~0.41, `intermediate`: ~0.29, `hard`: ~0.14.
* **Black Stars:** Located at approximately (`easy 1.0`, 0.85), (`intermediate`, 0.52), (`hard`, 0.40). No star at `easy`.
**3. Propper MDL (Bottom-Left)**
* **Trend Verification:** All three ILP-Scallop (noBCE) methods maintain high, stable performance for `easy 1.0` and `easy`, then decline sharply for `intermediate` and `hard`.
* **Data Points (Approximate):**
* **ILP-Scallop-Combo-noBCE (Blue):** `easy 1.0`: ~0.86, `easy`: ~0.86, `intermediate`: ~0.52, `hard`: ~0.36.
* **ILP-Scallop-NoisyCombo-noBCE (Orange):** `easy 1.0`: ~0.86, `easy`: ~0.86, `intermediate`: ~0.52, `hard`: ~0.38.
* **ILP-Scallop-MaxSynth-noBCE (Green):** `easy 1.0`: ~0.82, `easy`: ~0.82, `intermediate`: ~0.46, `hard`: ~0.34.
* **Black Stars:** Located at approximately (`hard`, 0.40). No stars at other difficulty levels.
**4. Propper BCE (Bottom-Right)**
* **Trend Verification:** Identical pattern to Propper MDL: stable high performance for easy tasks, then a decline.
* **Data Points (Approximate):**
* **ILP-Scallop-Combo-BCE (Blue):** `easy 1.0`: ~0.86, `easy`: ~0.86, `intermediate`: ~0.52, `hard`: ~0.36.
* **ILP-Scallop-NoisyCombo-BCE (Orange):** `easy 1.0`: ~0.86, `easy`: ~0.86, `intermediate`: ~0.52, `hard`: ~0.39.
* **ILP-Scallop-MaxSynth-BCE (Green):** `easy 1.0`: ~0.82, `easy`: ~0.82, `intermediate`: ~0.52, `hard`: ~0.38.
* **Black Stars:** None visible in this subplot.
### Key Observations
1. **Performance Degradation:** All methods across all subplots show decreasing F1 scores as task difficulty increases.
2. **Method Grouping:** The `Propper MDL` and `Propper BCE` (ILP-Scallop) methods exhibit a distinct "plateau-then-drop" pattern, maintaining near-peak performance from `easy 1.0` to `easy`, unlike the more linear decline in `Statistical ML` and `Popper`.
3. **BCE vs. noBCE:** Comparing the bottom two plots (`Propper MDL` vs. `Propper BCE`), the performance curves and final `hard` scores are very similar, suggesting the BCE (Binary Cross-Entropy) condition has minimal impact on the final outcome for these Scallop methods in this experiment.
4. **Black Star Pattern:** The black stars appear at consistent y-values across plots (e.g., ~0.85 at easy levels, ~0.52 at intermediate, ~0.40 at hard), but their presence varies by subplot. They likely represent a baseline, human performance, or an optimal benchmark for each difficulty level.
5. **Variance:** The shaded confidence intervals are widest for the `Statistical ML` methods, particularly GCN, indicating higher variance or less consistent performance. The `Propper` methods show tighter intervals.
### Interpretation
This set of charts evaluates the robustness of different algorithmic paradigms (Statistical ML, Inductive Logic Programming via Popper and Propper) on tasks of increasing difficulty.
* **Core Finding:** The task difficulty metric is a strong predictor of performance degradation for all tested methods. The "hard" category presents a significant challenge, reducing F1 scores to between 0.0 and 0.4.
* **Paradigm Comparison:** The `Propper` (ILP-Scallop) methods demonstrate superior robustness on easier tasks (`easy 1.0` and `easy`), maintaining F1 scores above 0.8, whereas `Statistical ML` and `Popper` methods begin degrading immediately. This suggests the Propper framework is better at leveraging the structure of simpler problems.
* **The "Hard" Problem:** The convergence of many methods towards low scores (0.0-0.4) at the `hard` level, alongside the consistent placement of the black star benchmark at ~0.40, implies this difficulty tier may represent a fundamental limit or a qualitatively different problem class that is challenging for all presented approaches.
* **Investigative Insight (Peircean):** The black stars act as an *index* pointing to a ground truth or reference performance. Their consistent y-values across plots suggest a standardized benchmark. Their absence in the `Propper BCE` plot and partial presence in others could indicate experimental design choices—perhaps that benchmark was not measured or is not applicable for all method comparisons. The near-identical results of `Propper MDL` and `Propper BCE` is a *sign* that the model's loss function (MDL vs. BCE) is not the critical factor for performance on these tasks; the underlying Scallop architecture or the data structure itself is the dominant cause.
DECODING INTELLIGENCE...