## Chart/Diagram Type: Grid of Line Charts
### Overview
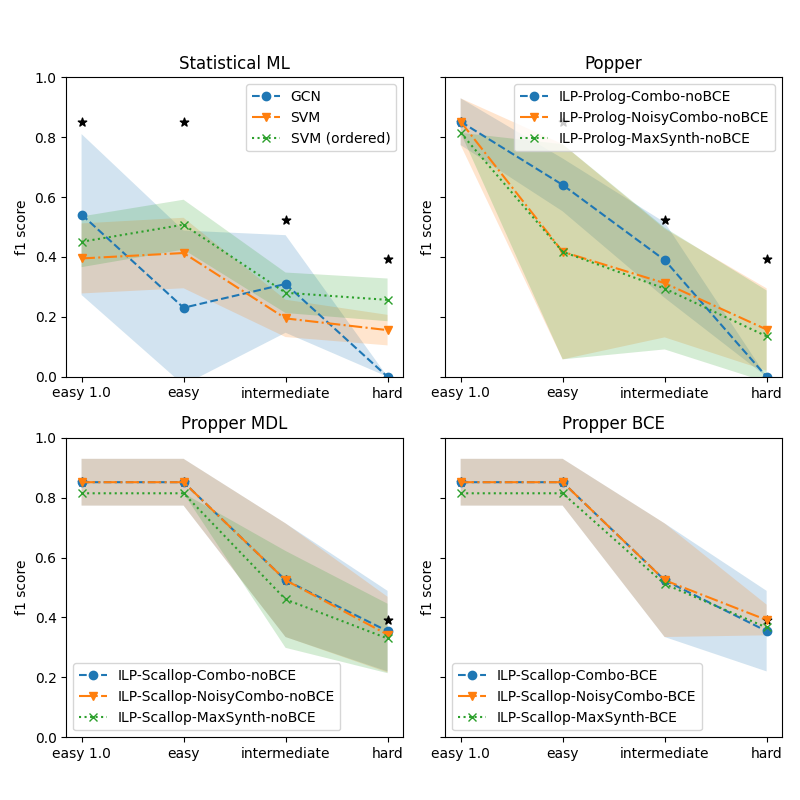
The image contains four line charts arranged in a 2x2 grid, each comparing model performance across task difficulty levels (easy 1.0, easy, intermediate, hard) using the f1 score metric. Each chart represents a different framework (Statistical ML, Popper, Popper MDL, Popper BCE) with distinct model variants.
### Components/Axes
- **X-axis**: Task difficulty levels labeled as "easy 1.0", "easy", "intermediate", "hard".
- **Y-axis**: f1 score ranging from 0.0 to 1.0.
- **Legends**:
- **Statistical ML**: GCN (blue solid line), SVM (orange dashed line), SVM (ordered) (green dotted line).
- **Popper**: ILP-Prolog-Combo-noBCE (blue solid), ILP-Prolog-NoisyCombo-noBCE (orange dashed), ILP-Prolog-MaxSynth-noBCE (green dotted).
- **Popper MDL**: ILP-Scallop-Combo-noBCE (blue solid), ILP-Scallop-NoisyCombo-noBCE (orange dashed), ILP-Scallop-MaxSynth-noBCE (green dotted).
- **Popper BCE**: ILP-Scallop-Combo-BCE (blue solid), ILP-Scallop-NoisyCombo-BCE (orange dashed), ILP-Scallop-MaxSynth-BCE (green dotted).
- **Shading**: Confidence intervals or variability bands around lines in Popper, Popper MDL, and Popper BCE charts.
### Detailed Analysis
#### Statistical ML
- **GCN (blue)**: Starts at ~0.55 (easy 1.0), drops to ~0.2 (easy), ~0.3 (intermediate), and ~0.0 (hard).
- **SVM (orange)**: Starts at ~0.4 (easy 1.0), remains stable at ~0.4 (easy), drops to ~0.2 (intermediate), and ~0.1 (hard).
- **SVM (ordered) (green)**: Starts at ~0.45 (easy 1.0), drops to ~0.3 (easy), ~0.25 (intermediate), and ~0.1 (hard).
- **Stars**: Two outliers at ~0.8 (easy 1.0) and ~0.6 (intermediate).
#### Popper
- **ILP-Prolog-Combo-noBCE (blue)**: Starts at ~0.8 (easy 1.0), drops to ~0.4 (easy), ~0.3 (intermediate), and ~0.2 (hard).
- **ILP-Prolog-NoisyCombo-noBCE (orange)**: Starts at ~0.6 (easy 1.0), drops to ~0.3 (easy), ~0.2 (intermediate), and ~0.1 (hard).
- **ILP-Prolog-MaxSynth-noBCE (green)**: Starts at ~0.7 (easy 1.0), drops to ~0.4 (easy), ~0.3 (intermediate), and ~0.2 (hard).
#### Popper MDL
- **ILP-Scallop-Combo-noBCE (blue)**: Starts at ~0.8 (easy 1.0), drops to ~0.6 (easy), ~0.5 (intermediate), and ~0.4 (hard).
- **ILP-Scallop-NoisyCombo-noBCE (orange)**: Starts at ~0.8 (easy 1.0), drops to ~0.5 (easy), ~0.4 (intermediate), and ~0.3 (hard).
- **ILP-Scallop-MaxSynth-noBCE (green)**: Starts at ~0.8 (easy 1.0), drops to ~0.5 (easy), ~0.4 (intermediate), and ~0.3 (hard).
#### Popper BCE
- **ILP-Scallop-Combo-BCE (blue)**: Starts at ~0.8 (easy 1.0), drops to ~0.6 (easy), ~0.5 (intermediate), and ~0.4 (hard).
- **ILP-Scallop-NoisyCombo-BCE (orange)**: Starts at ~0.8 (easy 1.0), drops to ~0.5 (easy), ~0.4 (intermediate), and ~0.3 (hard).
- **ILP-Scallop-MaxSynth-BCE (green)**: Starts at ~0.8 (easy 1.0), drops to ~0.5 (easy), ~0.4 (intermediate), and ~0.3 (hard).
### Key Observations
1. **Downward Trend**: All models show a consistent decline in f1 score as task difficulty increases.
2. **Model Variability**:
- **Statistical ML**: GCN performs worst at higher difficulties, while SVM (ordered) maintains slightly better stability.
- **Popper**: ILP-Prolog-Combo-noBCE starts strongest but declines sharply.
- **Popper MDL/BCE**: ILP-Scallop models maintain higher scores across difficulties compared to Popper variants.
3. **Confidence Intervals**: Shaded regions in Popper, Popper MDL, and Popper BCE charts suggest higher variability in performance for some models (e.g., ILP-Prolog-NoisyCombo-noBCE).
4. **Outliers**: Two stars in Statistical ML at easy 1.0 (~0.8) and intermediate (~0.6) may indicate exceptional or anomalous results.
### Interpretation
- **Performance Degradation**: All models struggle with harder tasks, but the rate of decline varies. ILP-Prolog-Combo-noBCE (Popper) and GCN (Statistical ML) show the steepest drops.
- **Robustness**: ILP-Scallop models (Popper MDL/BCE) exhibit greater resilience to difficulty increases, maintaining higher f1 scores.
- **Ordered SVM**: In Statistical ML, the "ordered" variant underperforms the standard SVM, suggesting ordering constraints may harm generalization.
- **NoBCE vs. BCE**: Models with "noBCE" (no background context) in Popper frameworks perform slightly worse than their BCE counterparts, indicating background context may aid generalization.
- **Anomalies**: The stars in Statistical ML at easy 1.0 and intermediate could represent overfitting or data leakage, warranting further investigation.
This analysis highlights trade-offs between model complexity, task difficulty, and generalization, with ILP-Scallop models emerging as the most robust across frameworks.