TECHNICAL ASSET FINGERPRINT
261c3c88be897e6524c901c1
Click to view fullscreen
Press ESC or click to close
FOUND IN PAPERS
EXPERT: gemini-2.0-flash VERSION 1
RUNTIME: nugit/gemini/gemini-2.0-flash
INTEL_VERIFIED
## Scatter Plot Matrix: Brain Alignment vs. Model Performance
### Overview
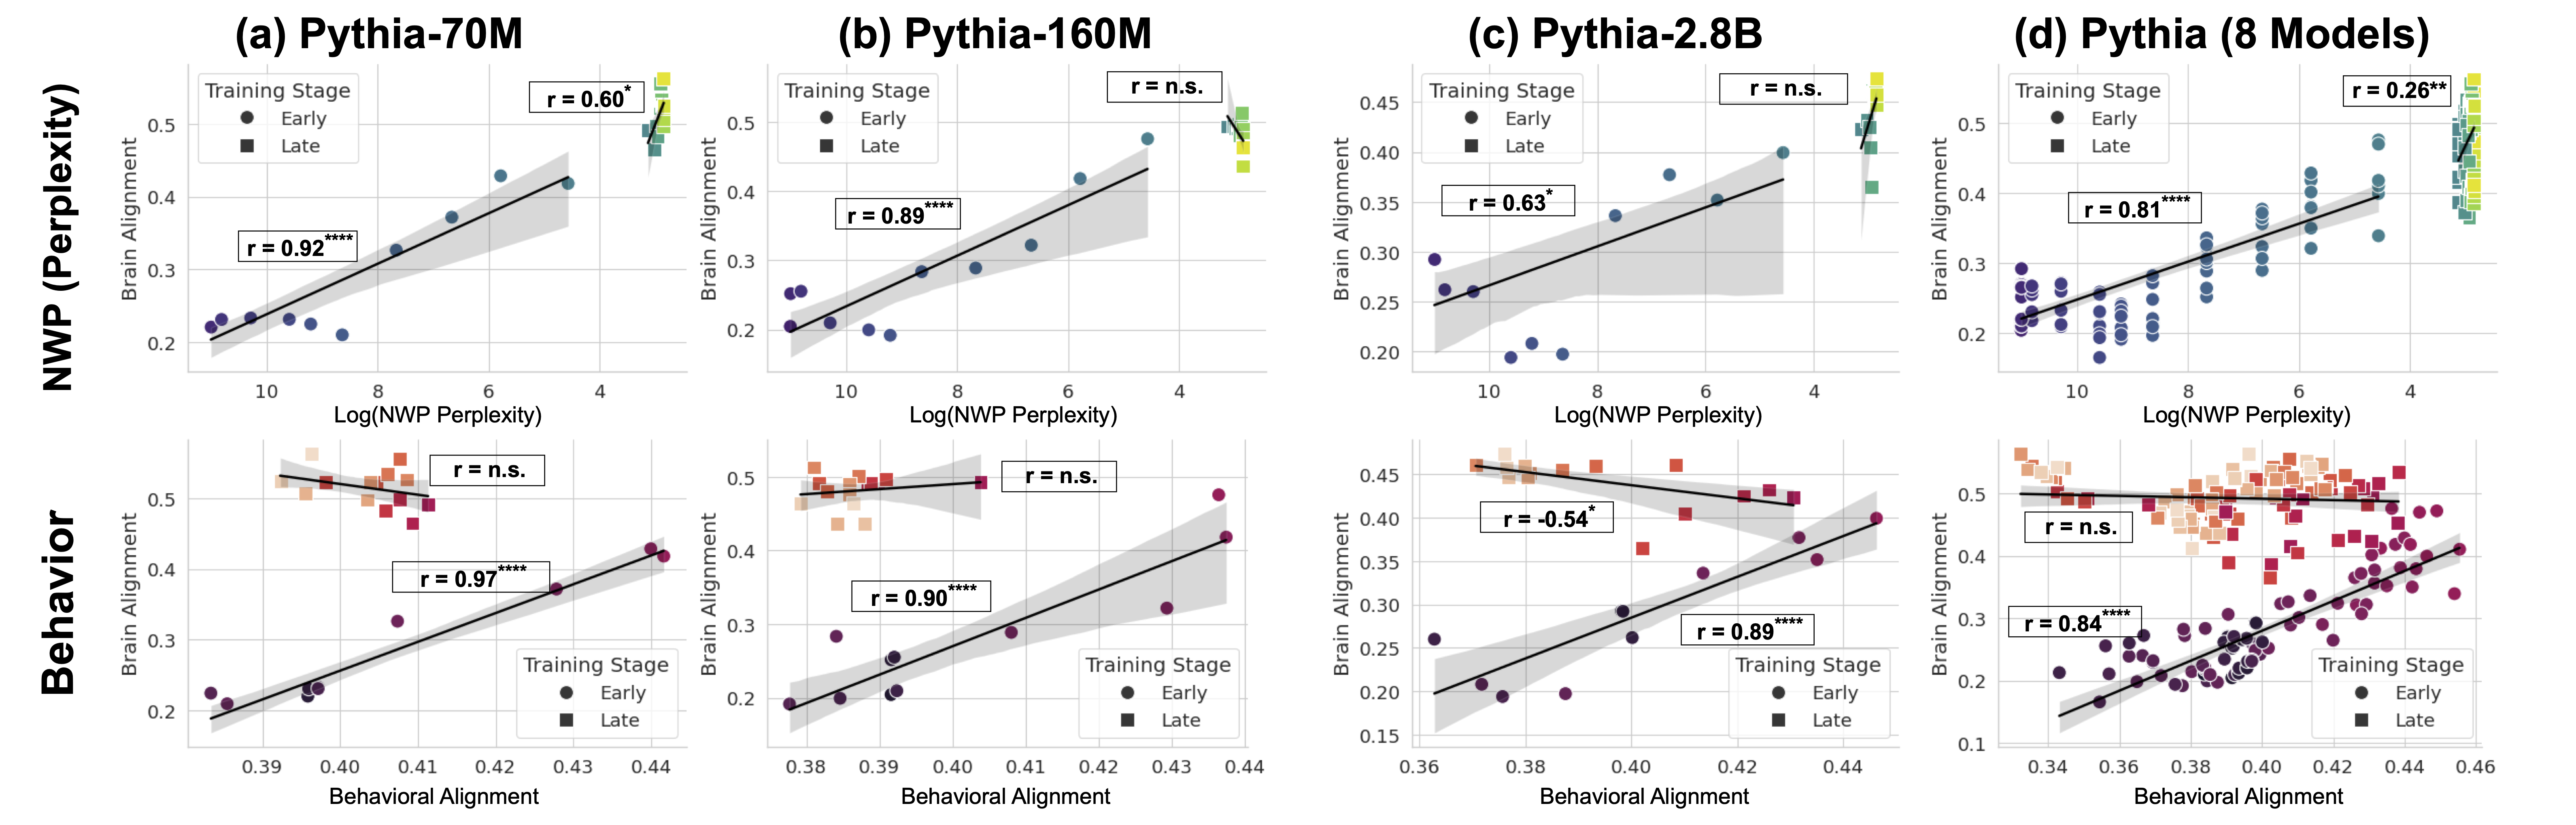
The image presents a matrix of scatter plots analyzing the relationship between brain alignment and model performance for different Pythia models. Each column represents a different Pythia model size (70M, 160M, 2.8B, and 8 Models). Each model has two scatter plots, one plotting "NWP (Perplexity)" against "Brain Alignment", and the other plotting "Behavioral Alignment" against "Brain Alignment". The data points are color-coded to indicate the training stage (Early vs. Late). Each plot includes a regression line with a confidence interval and the Pearson correlation coefficient (r-value) with significance markers.
### Components/Axes
* **Titles:** The plots are arranged in a 2x4 grid, with titles above each column indicating the model: (a) Pythia-70M, (b) Pythia-160M, (c) Pythia-2.8B, (d) Pythia (8 Models).
* **Y-Axes (Left Column):** The left column has a shared y-axis labeled "NWP (Perplexity)" for the top row and "Behavior" for the bottom row.
* **Y-Axes (All Plots):** All plots have a y-axis labeled "Brain Alignment". The scale ranges from approximately 0.2 to 0.5 for the top row and varies slightly for the bottom row.
* **X-Axes (Top Row):** The top row has an x-axis labeled "Log(NWP Perplexity)". The scale ranges from approximately 4 to 10.
* **X-Axes (Bottom Row):** The bottom row has an x-axis labeled "Behavioral Alignment". The scale ranges from approximately 0.38 to 0.44.
* **Legend:** Each plot contains a legend in the top-left corner indicating the "Training Stage": "Early" (represented by circles) and "Late" (represented by squares). The "Early" data points are colored in shades of purple/blue, while the "Late" data points are colored in shades of orange/yellow/red.
* **Correlation Coefficient (r):** Each plot displays the Pearson correlation coefficient (r) with significance markers (*, **, ****). "n.s." indicates a non-significant correlation.
* **Regression Line:** Each plot includes a regression line with a shaded confidence interval.
### Detailed Analysis
**Row 1: NWP (Perplexity) vs. Brain Alignment**
* **(a) Pythia-70M:**
* Trend: The "Early" data points (blue/purple circles) show a positive trend.
* r = 0.92****
* "Late" data points (orange/yellow/red squares) are clustered near x=4.
* r = 0.60*
* **(b) Pythia-160M:**
* Trend: The "Early" data points (blue/purple circles) show a positive trend.
* r = 0.89****
* "Late" data points (orange/yellow/red squares) are clustered near x=4.
* r = n.s.
* **(c) Pythia-2.8B:**
* Trend: The "Early" data points (blue/purple circles) show a positive trend.
* r = 0.63*
* "Late" data points (orange/yellow/red squares) are clustered near x=4.
* r = n.s.
* **(d) Pythia (8 Models):**
* Trend: The "Early" data points (blue/purple circles) show a positive trend.
* r = 0.81****
* "Late" data points (orange/yellow/red squares) are clustered near x=4.
* r = 0.26**
**Row 2: Behavioral Alignment vs. Brain Alignment**
* **(a) Pythia-70M:**
* Trend: The "Early" data points (blue/purple circles) show a positive trend.
* r = 0.97****
* The "Late" data points (orange/yellow/red squares) show a slight negative trend.
* r = n.s.
* **(b) Pythia-160M:**
* Trend: The "Early" data points (blue/purple circles) show a positive trend.
* r = 0.90****
* The "Late" data points (orange/yellow/red squares) show a slight negative trend.
* r = n.s.
* **(c) Pythia-2.8B:**
* Trend: The "Early" data points (blue/purple circles) show a positive trend.
* r = 0.89****
* The "Late" data points (orange/yellow/red squares) show a negative trend.
* r = -0.54*
* **(d) Pythia (8 Models):**
* Trend: The "Early" data points (blue/purple circles) show a positive trend.
* r = 0.84****
* The "Late" data points (orange/yellow/red squares) show a slight negative trend.
* r = n.s.
### Key Observations
* **NWP (Perplexity) vs. Brain Alignment:** There is a generally positive correlation between Log(NWP Perplexity) and Brain Alignment for the "Early" training stage across all models. The "Late" training stage data points are clustered at low Log(NWP Perplexity) values.
* **Behavioral Alignment vs. Brain Alignment:** There is a strong positive correlation between Behavioral Alignment and Brain Alignment for the "Early" training stage across all models. The "Late" training stage shows a weaker or negative correlation.
* **Significance:** The correlation coefficients for the "Early" training stage are generally statistically significant (p < 0.0001), while the "Late" training stage correlations are often not significant.
### Interpretation
The data suggests that brain alignment, as measured in these models, is strongly correlated with both NWP (Perplexity) and Behavioral Alignment during the early stages of training. The strong positive correlations indicate that as the models learn and their internal representations become more aligned with the human brain, their performance on language tasks (as measured by perplexity) and their behavioral alignment also improve.
The clustering of "Late" training stage data points at low Log(NWP Perplexity) values in the top row suggests that the models reach a certain level of performance beyond which further training does not significantly improve perplexity. The weaker or negative correlations observed for the "Late" training stage in the bottom row could indicate that after a certain point, improvements in behavioral alignment do not necessarily translate to improvements in brain alignment, or vice versa. This could be due to overfitting or the models developing different strategies for solving the tasks.
The differences in correlation strength and significance between the "Early" and "Late" training stages highlight the dynamic relationship between brain alignment and model performance during the learning process. The plots provide evidence that brain alignment is a useful metric for understanding and potentially improving the performance of language models, particularly during the initial stages of training.
DECODING INTELLIGENCE...
EXPERT: nemotron-free VERSION 1
RUNTIME: free/nvidia/nemotron-nano-12b-v2-vl:free
INTEL_VERIFIED
## Scatter Plots: Brain Alignment vs. Model Parameters
### Overview
The image contains eight scatter plots comparing brain alignment (NWP and Behavioral) with model parameters across different Pythia architectures and training stages. Each plot includes correlation coefficients (r), training stage indicators (Early/Late), and confidence intervals. Data points are color-coded by training stage, with Early (circles) and Late (squares) stages.
---
### Components/Axes
1. **Top Row (NWP Perplexity vs. Brain Alignment)**:
- **X-axis**: Log(NWP Perplexity) (logarithmic scale, 4–10)
- **Y-axis**: Brain Alignment (Perplexity) (linear scale, 0.15–0.55)
- **Legends**: Early (blue circles), Late (orange squares)
- **Correlation Labels**: r-values (e.g., r=0.92, r=0.60) with asterisks for significance.
2. **Bottom Row (Behavioral Alignment vs. Brain Alignment)**:
- **X-axis**: Behavioral Alignment (linear scale, 0.36–0.46)
- **Y-axis**: Brain Alignment (linear scale, 0.15–0.55)
- **Legends**: Early (blue circles), Late (orange squares)
- **Correlation Labels**: r-values (e.g., r=0.97, r=-0.54) with asterisks.
---
### Detailed Analysis
#### Top Row (NWP Perplexity vs. Brain Alignment)
1. **(a) Pythia-70M**:
- Early: r=0.92 (strong positive correlation), Late: r=0.60 (moderate positive).
- Trend: Early data points cluster tightly along the line; Late points show wider dispersion.
- Confidence Interval: Shaded gray band indicates variability.
2. **(b) Pythia-160M**:
- Early: r=0.89 (strong positive), Late: r=n.s. (no significant correlation).
- Trend: Early points align closely; Late points scatter broadly, especially at high perplexity.
3. **(c) Pythia-2.8B**:
- Early: r=0.63 (moderate positive), Late: r=n.s.
- Trend: Early points show a gradual increase; Late points cluster at lower brain alignment.
4. **(d) Pythia (8 Models)**:
- Early: r=0.81 (strong positive), Late: r=0.26 (weak positive).
- Trend: Early points follow a steep upward slope; Late points are more dispersed.
#### Bottom Row (Behavioral Alignment vs. Brain Alignment)
1. **(a) Pythia-70M**:
- Early: r=0.97 (very strong positive), Late: r=n.s.
- Trend: Early points align almost perfectly; Late points scatter widely.
2. **(b) Pythia-160M**:
- Early: r=0.89 (strong positive), Late: r=n.s.
- Trend: Early points cluster tightly; Late points show no clear pattern.
3. **(c) Pythia-2.8B**:
- Early: r=0.89 (strong positive), Late: r=-0.54 (negative correlation).
- Trend: Early points follow a steep upward slope; Late points show a downward trend.
4. **(d) Pythia (8 Models)**:
- Early: r=0.84 (strong positive), Late: r=0.84 (strong positive).
- Trend: Both stages show a consistent upward slope, with Late points slightly more dispersed.
---
### Key Observations
1. **Early Training Dominance**: Early-stage models consistently show stronger correlations (r > 0.8) between brain alignment and model parameters, suggesting better alignment during initial training.
2. **Late-Stage Variability**: Late-stage correlations are weaker or non-significant (r=n.s.) in most cases, except Pythia (8 Models), where Late retains r=0.84.
3. **Negative Correlation Anomaly**: Pythia-2.8B Late stage exhibits a negative correlation (r=-0.54), indicating an inverse relationship between behavioral alignment and brain alignment.
4. **Confidence Intervals**: Shaded regions highlight uncertainty, with wider bands in Late stages, reflecting higher variability.
---
### Interpretation
1. **Training Dynamics**: Early training stages likely capture foundational patterns in brain alignment, while Late stages may overfit or diverge due to optimization pressures.
2. **Model Complexity**: Larger models (e.g., Pythia-160M) show reduced Late-stage correlations, possibly due to increased capacity leading to overfitting.
3. **Behavioral Alignment**: Strong positive correlations in Early stages suggest that behavioral alignment is a robust proxy for brain alignment during initial learning.
4. **Anomaly in Pythia-2.8B Late**: The negative correlation may indicate a shift in learning dynamics, such as prioritizing different features or data artifacts.
This analysis underscores the importance of early training stages in aligning model parameters with brain and behavioral data, while Late stages require careful regularization to maintain alignment.
DECODING INTELLIGENCE...