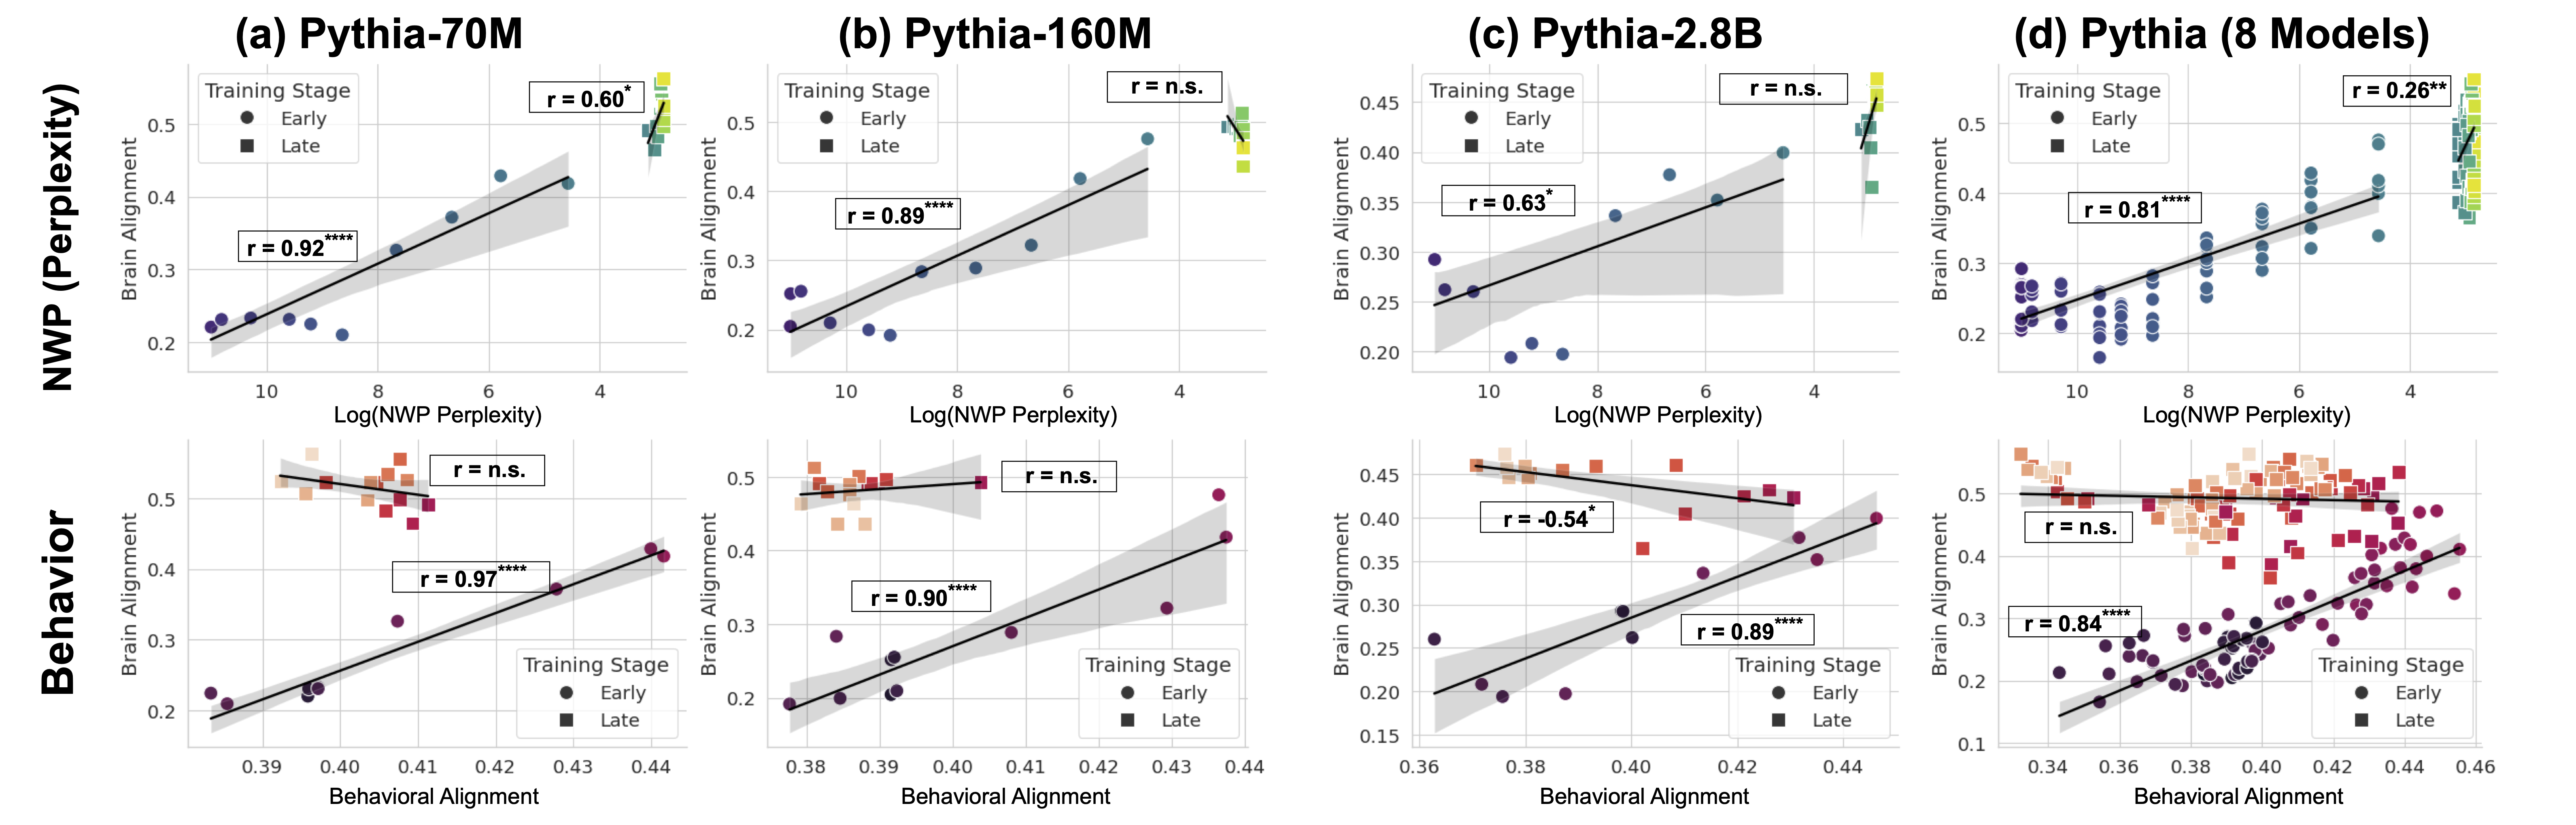
## Scatter Plots: Alignment vs. Perplexity & Behavior
### Overview
The image presents four scatter plots, labeled (a) through (d), each representing a different model: Pythia-70M, Pythia-160M, Pythia-2.8B, and Pythia (8 Models). Each plot contains two scatter plots stacked vertically. The top plot shows the relationship between NWP (Perplexity) and Brain Alignment, while the bottom plot shows the relationship between Behavior and Behavioral Alignment. Each plot uses two colors to differentiate between "Early" and "Late" training stages, and includes correlation coefficients (r) with significance indicators.
### Components/Axes
Each plot shares the following components:
* **X-axis:** Log(NWP Perplexity) in plots (a) and (b), and Behavioral Alignment in plots (c) and (d). Scales range approximately from 3.8 to 10 in (a) and (b), and 0.38 to 0.46 in (c) and (d).
* **Y-axis:** Brain Alignment in the top plots (a-d), and Behavior in the bottom plots (a-d). Scales range approximately from 0.2 to 0.5 in all plots.
* **Legend:** Located in the top-left corner of each plot, distinguishing between "Early" (green) and "Late" (red) training stages.
* **Correlation Coefficient (r):** Displayed in each plot, indicating the strength and direction of the linear relationship between the variables. Significance is indicated by asterisks: * (p < 0.05), ** (p < 0.01), *** (p < 0.001), and n.s. (not significant).
* **Regression Line:** A black line representing the linear regression fit for each training stage (Early and Late).
* **Shaded Area:** A grey shaded area around each regression line, representing the 95% confidence interval.
### Detailed Analysis or Content Details
**Plot (a): Pythia-70M**
* **Top Plot (NWP Perplexity vs. Brain Alignment):**
* Early (Green): Line slopes downward. r = 0.80*, indicating a strong positive correlation. Approximately 15 data points.
* Late (Red): Line slopes downward. r = 0.92***, indicating a very strong positive correlation. Approximately 15 data points.
* **Bottom Plot (Behavior vs. Behavioral Alignment):**
* Early (Green): Line slopes upward. r = n.s., indicating no significant correlation. Approximately 15 data points.
* Late (Red): Line slopes upward. r = 0.97***, indicating a very strong positive correlation. Approximately 15 data points.
**Plot (b): Pythia-160M**
* **Top Plot (NWP Perplexity vs. Brain Alignment):**
* Early (Green): Line is approximately horizontal. r = n.s., indicating no significant correlation. Approximately 15 data points.
* Late (Red): Line slopes downward. r = 0.89***, indicating a very strong positive correlation. Approximately 15 data points.
* **Bottom Plot (Behavior vs. Behavioral Alignment):**
* Early (Green): Line slopes upward. r = n.s., indicating no significant correlation. Approximately 15 data points.
* Late (Red): Line slopes upward. r = 0.90***, indicating a very strong positive correlation. Approximately 15 data points.
**Plot (c): Pythia-2.8B**
* **Top Plot (NWP Perplexity vs. Brain Alignment):**
* Early (Green): Line is approximately horizontal. r = n.s., indicating no significant correlation. Approximately 15 data points.
* Late (Red): Line slopes downward. r = 0.83***, indicating a very strong positive correlation. Approximately 15 data points.
* **Bottom Plot (Behavior vs. Behavioral Alignment):**
* Early (Green): Line slopes upward. r = 0.45*, indicating a weak positive correlation. Approximately 15 data points.
* Late (Red): Line slopes upward. r = 0.89***, indicating a very strong positive correlation. Approximately 15 data points.
**Plot (d): Pythia (8 Models)**
* **Top Plot (NWP Perplexity vs. Brain Alignment):**
* Early (Green): Line slopes downward. r = 0.28*, indicating a weak positive correlation. Approximately 15 data points.
* Late (Red): Line slopes downward. r = 0.81***, indicating a very strong positive correlation. Approximately 15 data points.
* **Bottom Plot (Behavior vs. Behavioral Alignment):**
* Early (Green): Line slopes upward. r = n.s., indicating no significant correlation. Approximately 15 data points.
* Late (Red): Line slopes upward. r = 0.84***, indicating a very strong positive correlation. Approximately 15 data points.
### Key Observations
* The "Late" training stage consistently shows a strong negative correlation between NWP Perplexity and Brain Alignment across all models.
* The "Late" training stage consistently shows a strong positive correlation between Behavior and Behavioral Alignment across all models.
* The "Early" training stage often shows no significant correlation or a weak correlation in both the top and bottom plots.
* The strength of the correlation generally increases with model size (from 70M to 2.8B).
* The Pythia (8 Models) plot shows a weaker correlation in the top plot for the "Early" stage compared to the other models.
### Interpretation
The data suggests that as models are trained ("Late" stage), they exhibit a stronger alignment between their internal representations (Brain Alignment) and their performance on language tasks (NWP Perplexity). Lower perplexity (better performance) is associated with higher brain alignment. Similarly, the "Late" stage shows a strong alignment between the model's behavior and its behavioral alignment, indicating that the model is learning to behave in a more consistent and predictable manner.
The lack of significant correlation in the "Early" stage suggests that the models are still in a phase of exploration and haven't yet converged on stable representations or behaviors. The increasing correlation with model size indicates that larger models are better able to learn and maintain these alignments.
The outlier in plot (d) for the "Early" stage in the top plot suggests that there might be some variability in the initial stages of training, or that the relationship between NWP Perplexity and Brain Alignment is more complex for larger models. The consistent strong correlations in the "Late" stage across all models suggest a fundamental principle of language model training: as models learn, they develop more coherent internal representations and behaviors.