## Scatter Plots: Brain Alignment vs. Model Parameters
### Overview
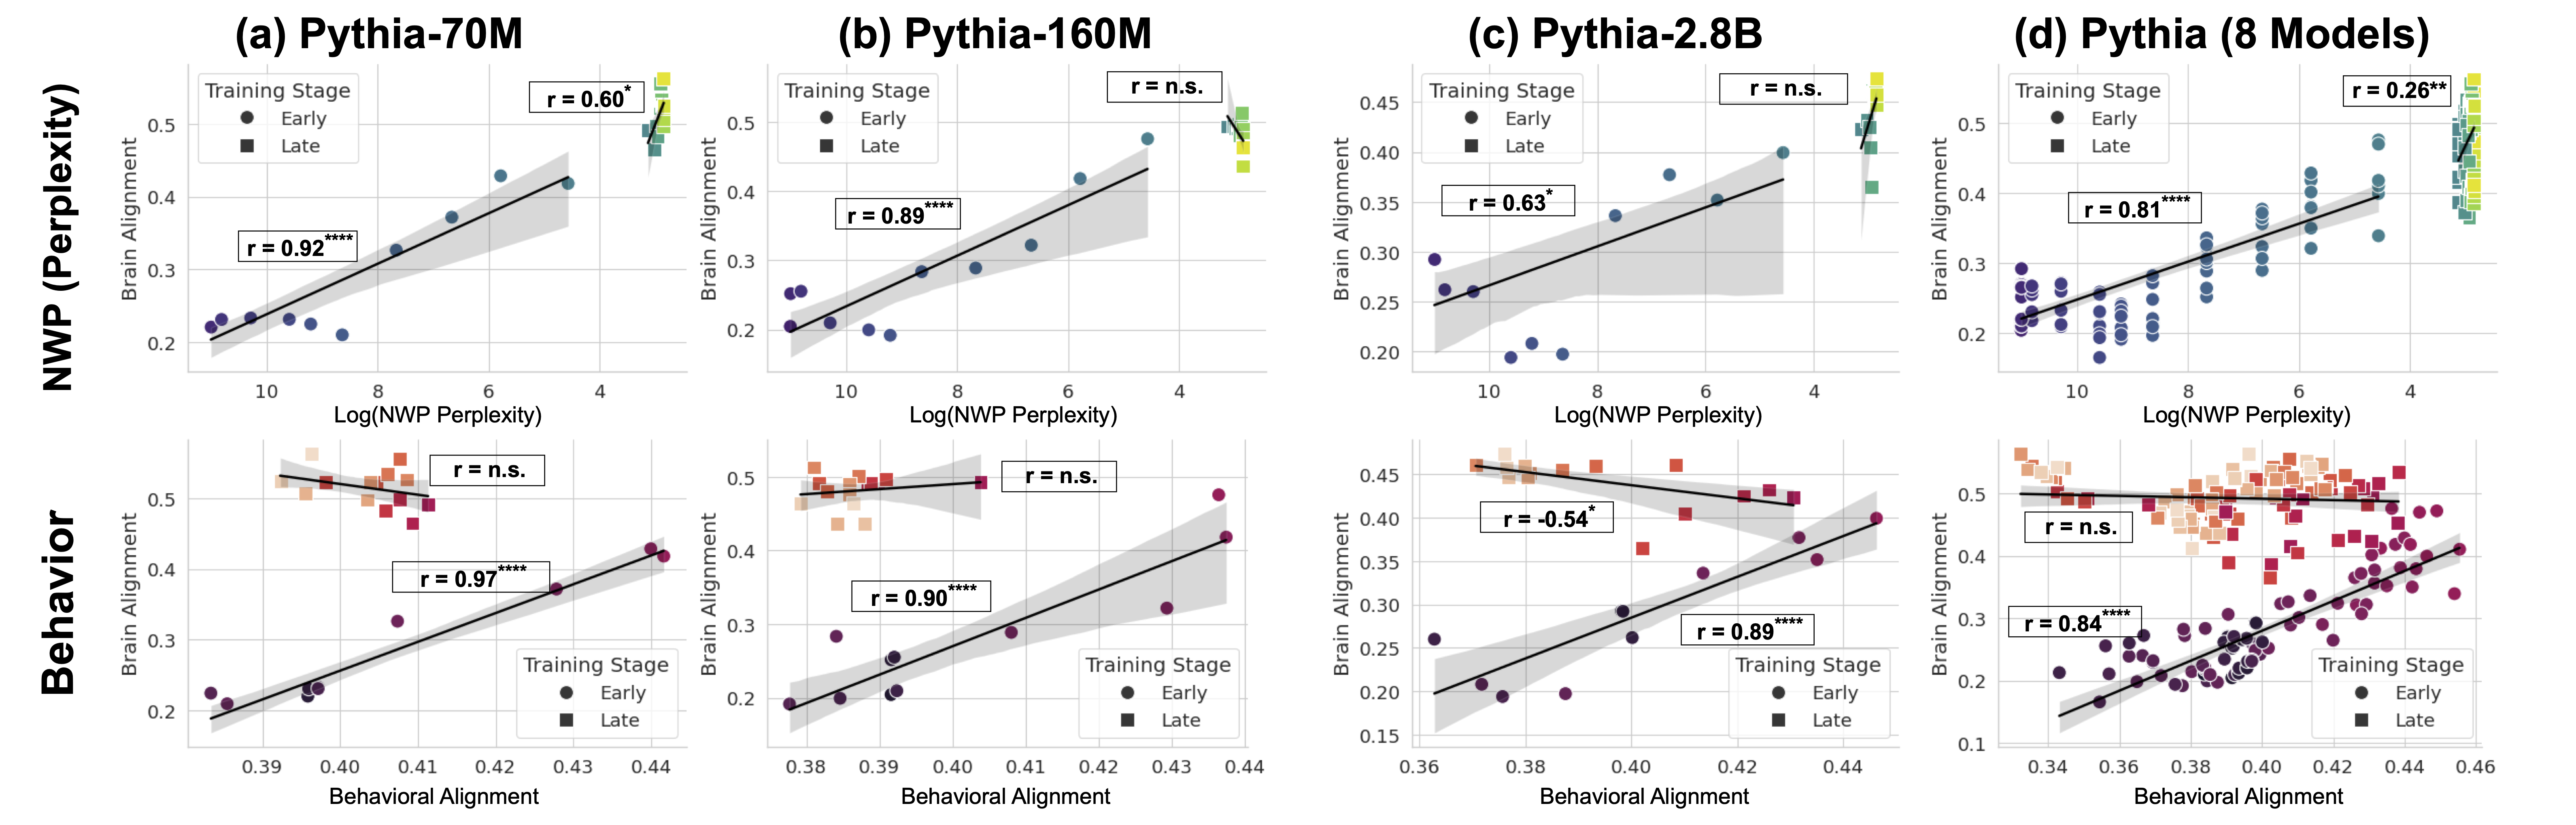
The image contains eight scatter plots comparing brain alignment (NWP and Behavioral) with model parameters across different Pythia architectures and training stages. Each plot includes correlation coefficients (r), training stage indicators (Early/Late), and confidence intervals. Data points are color-coded by training stage, with Early (circles) and Late (squares) stages.
---
### Components/Axes
1. **Top Row (NWP Perplexity vs. Brain Alignment)**:
- **X-axis**: Log(NWP Perplexity) (logarithmic scale, 4–10)
- **Y-axis**: Brain Alignment (Perplexity) (linear scale, 0.15–0.55)
- **Legends**: Early (blue circles), Late (orange squares)
- **Correlation Labels**: r-values (e.g., r=0.92, r=0.60) with asterisks for significance.
2. **Bottom Row (Behavioral Alignment vs. Brain Alignment)**:
- **X-axis**: Behavioral Alignment (linear scale, 0.36–0.46)
- **Y-axis**: Brain Alignment (linear scale, 0.15–0.55)
- **Legends**: Early (blue circles), Late (orange squares)
- **Correlation Labels**: r-values (e.g., r=0.97, r=-0.54) with asterisks.
---
### Detailed Analysis
#### Top Row (NWP Perplexity vs. Brain Alignment)
1. **(a) Pythia-70M**:
- Early: r=0.92 (strong positive correlation), Late: r=0.60 (moderate positive).
- Trend: Early data points cluster tightly along the line; Late points show wider dispersion.
- Confidence Interval: Shaded gray band indicates variability.
2. **(b) Pythia-160M**:
- Early: r=0.89 (strong positive), Late: r=n.s. (no significant correlation).
- Trend: Early points align closely; Late points scatter broadly, especially at high perplexity.
3. **(c) Pythia-2.8B**:
- Early: r=0.63 (moderate positive), Late: r=n.s.
- Trend: Early points show a gradual increase; Late points cluster at lower brain alignment.
4. **(d) Pythia (8 Models)**:
- Early: r=0.81 (strong positive), Late: r=0.26 (weak positive).
- Trend: Early points follow a steep upward slope; Late points are more dispersed.
#### Bottom Row (Behavioral Alignment vs. Brain Alignment)
1. **(a) Pythia-70M**:
- Early: r=0.97 (very strong positive), Late: r=n.s.
- Trend: Early points align almost perfectly; Late points scatter widely.
2. **(b) Pythia-160M**:
- Early: r=0.89 (strong positive), Late: r=n.s.
- Trend: Early points cluster tightly; Late points show no clear pattern.
3. **(c) Pythia-2.8B**:
- Early: r=0.89 (strong positive), Late: r=-0.54 (negative correlation).
- Trend: Early points follow a steep upward slope; Late points show a downward trend.
4. **(d) Pythia (8 Models)**:
- Early: r=0.84 (strong positive), Late: r=0.84 (strong positive).
- Trend: Both stages show a consistent upward slope, with Late points slightly more dispersed.
---
### Key Observations
1. **Early Training Dominance**: Early-stage models consistently show stronger correlations (r > 0.8) between brain alignment and model parameters, suggesting better alignment during initial training.
2. **Late-Stage Variability**: Late-stage correlations are weaker or non-significant (r=n.s.) in most cases, except Pythia (8 Models), where Late retains r=0.84.
3. **Negative Correlation Anomaly**: Pythia-2.8B Late stage exhibits a negative correlation (r=-0.54), indicating an inverse relationship between behavioral alignment and brain alignment.
4. **Confidence Intervals**: Shaded regions highlight uncertainty, with wider bands in Late stages, reflecting higher variability.
---
### Interpretation
1. **Training Dynamics**: Early training stages likely capture foundational patterns in brain alignment, while Late stages may overfit or diverge due to optimization pressures.
2. **Model Complexity**: Larger models (e.g., Pythia-160M) show reduced Late-stage correlations, possibly due to increased capacity leading to overfitting.
3. **Behavioral Alignment**: Strong positive correlations in Early stages suggest that behavioral alignment is a robust proxy for brain alignment during initial learning.
4. **Anomaly in Pythia-2.8B Late**: The negative correlation may indicate a shift in learning dynamics, such as prioritizing different features or data artifacts.
This analysis underscores the importance of early training stages in aligning model parameters with brain and behavioral data, while Late stages require careful regularization to maintain alignment.