# Technical Document Extraction: High-d Case Analysis
## Title
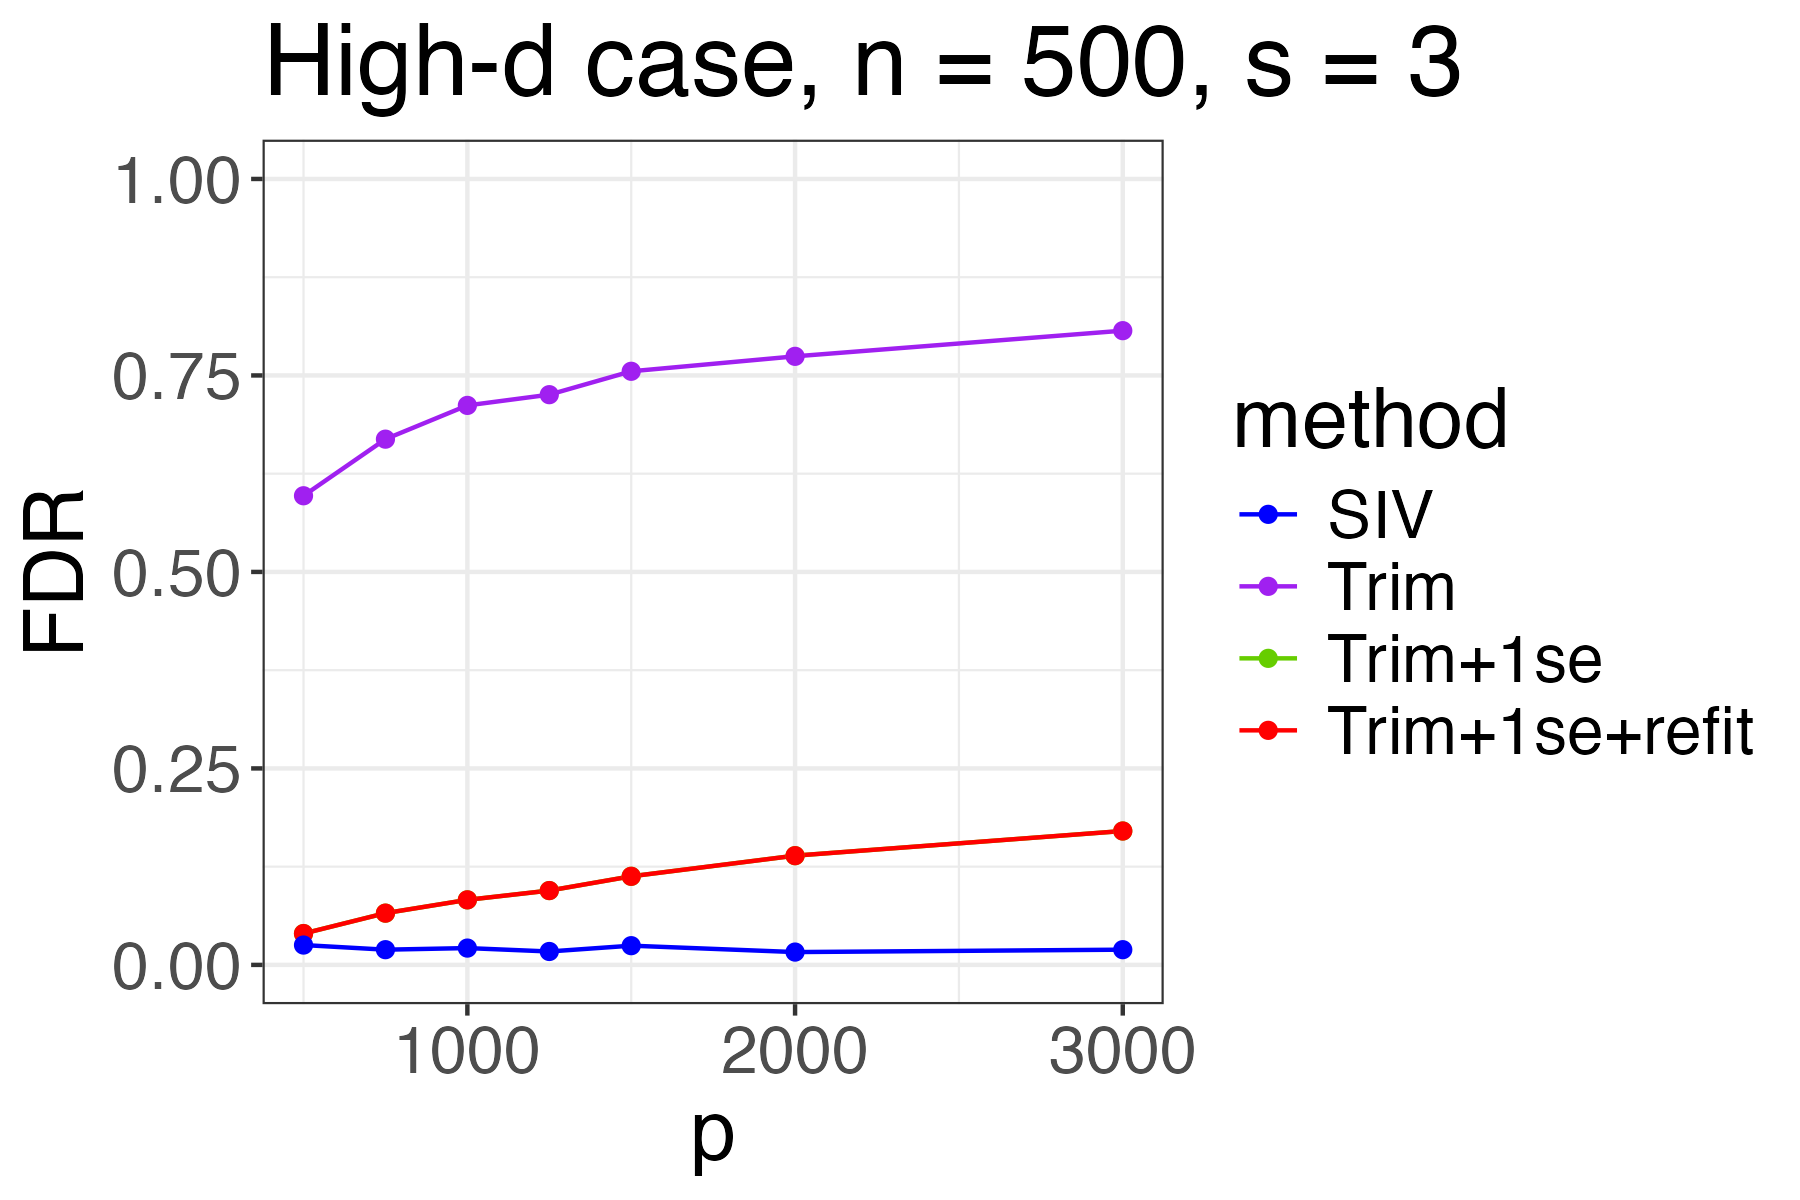
**High-d case, n = 500, s = 3**
---
## Axes Labels
- **X-axis**: `p` (ranges from 1000 to 3000)
- **Y-axis**: `FDR` (False Discovery Rate, ranges from 0.00 to 1.00)
---
## Legend
- **Position**: Right side of the chart
- **Methods**:
- **SIV**: Blue line (solid)
- **Trim**: Purple line (solid)
- **Trim+1se**: Green line (dotted, *not visible in the chart*)
- **Trim+1se+refit**: Red line (solid)
---
## Chart Components
### Main Chart
- **Type**: Line graph
- **Data Series**:
1. **SIV (Blue)**:
- **Trend**: Flat line near `FDR = 0.01` across all `p` values.
- **Data Points**:
- `p = 1000`: ~0.01
- `p = 2000`: ~0.01
- `p = 3000`: ~0.01
2. **Trim (Purple)**:
- **Trend**: Steadily increasing from `p = 1000` to `p = 3000`.
- **Data Points**:
- `p = 1000`: ~0.60
- `p = 2000`: ~0.75
- `p = 3000`: ~0.80
3. **Trim+1se+refit (Red)**:
- **Trend**: Gradual increase from `p = 1000` to `p = 3000`.
- **Data Points**:
- `p = 1000`: ~0.05
- `p = 2000`: ~0.12
- `p = 3000`: ~0.15
4. **Trim+1se (Green)**:
- **Trend**: Not visible in the chart (possibly overlapping or data not plotted).
---
## Key Observations
1. **Trim Method**: Shows the highest FDR, increasing consistently with `p`.
2. **Trim+1se+refit**: Demonstrates a moderate upward trend, significantly lower than Trim.
3. **SIV**: Maintains a near-zero FDR across all `p` values.
4. **Missing Data**: The `Trim+1se` method (green) is absent from the chart, suggesting either overlapping lines or omitted data.
---
## Spatial Grounding
- **Legend Position**: Right-aligned, outside the plot area.
- **Data Point Colors**:
- Blue (SIV) matches the flat line.
- Purple (Trim) matches the steeply rising line.
- Red (Trim+1se+refit) matches the gradual rise.
- Green (Trim+1se) is not visible, confirming absence in the chart.
---
## Notes
- The chart focuses on comparing FDR performance across methods in a high-dimensional setting (`n = 500`, `s = 3`).
- No textual blocks or additional diagrams are present.
- All extracted data is based on visual interpretation of the line graph.