## Line Chart: Reward Margin Between Preferred and Undesirable Outputs
### Overview
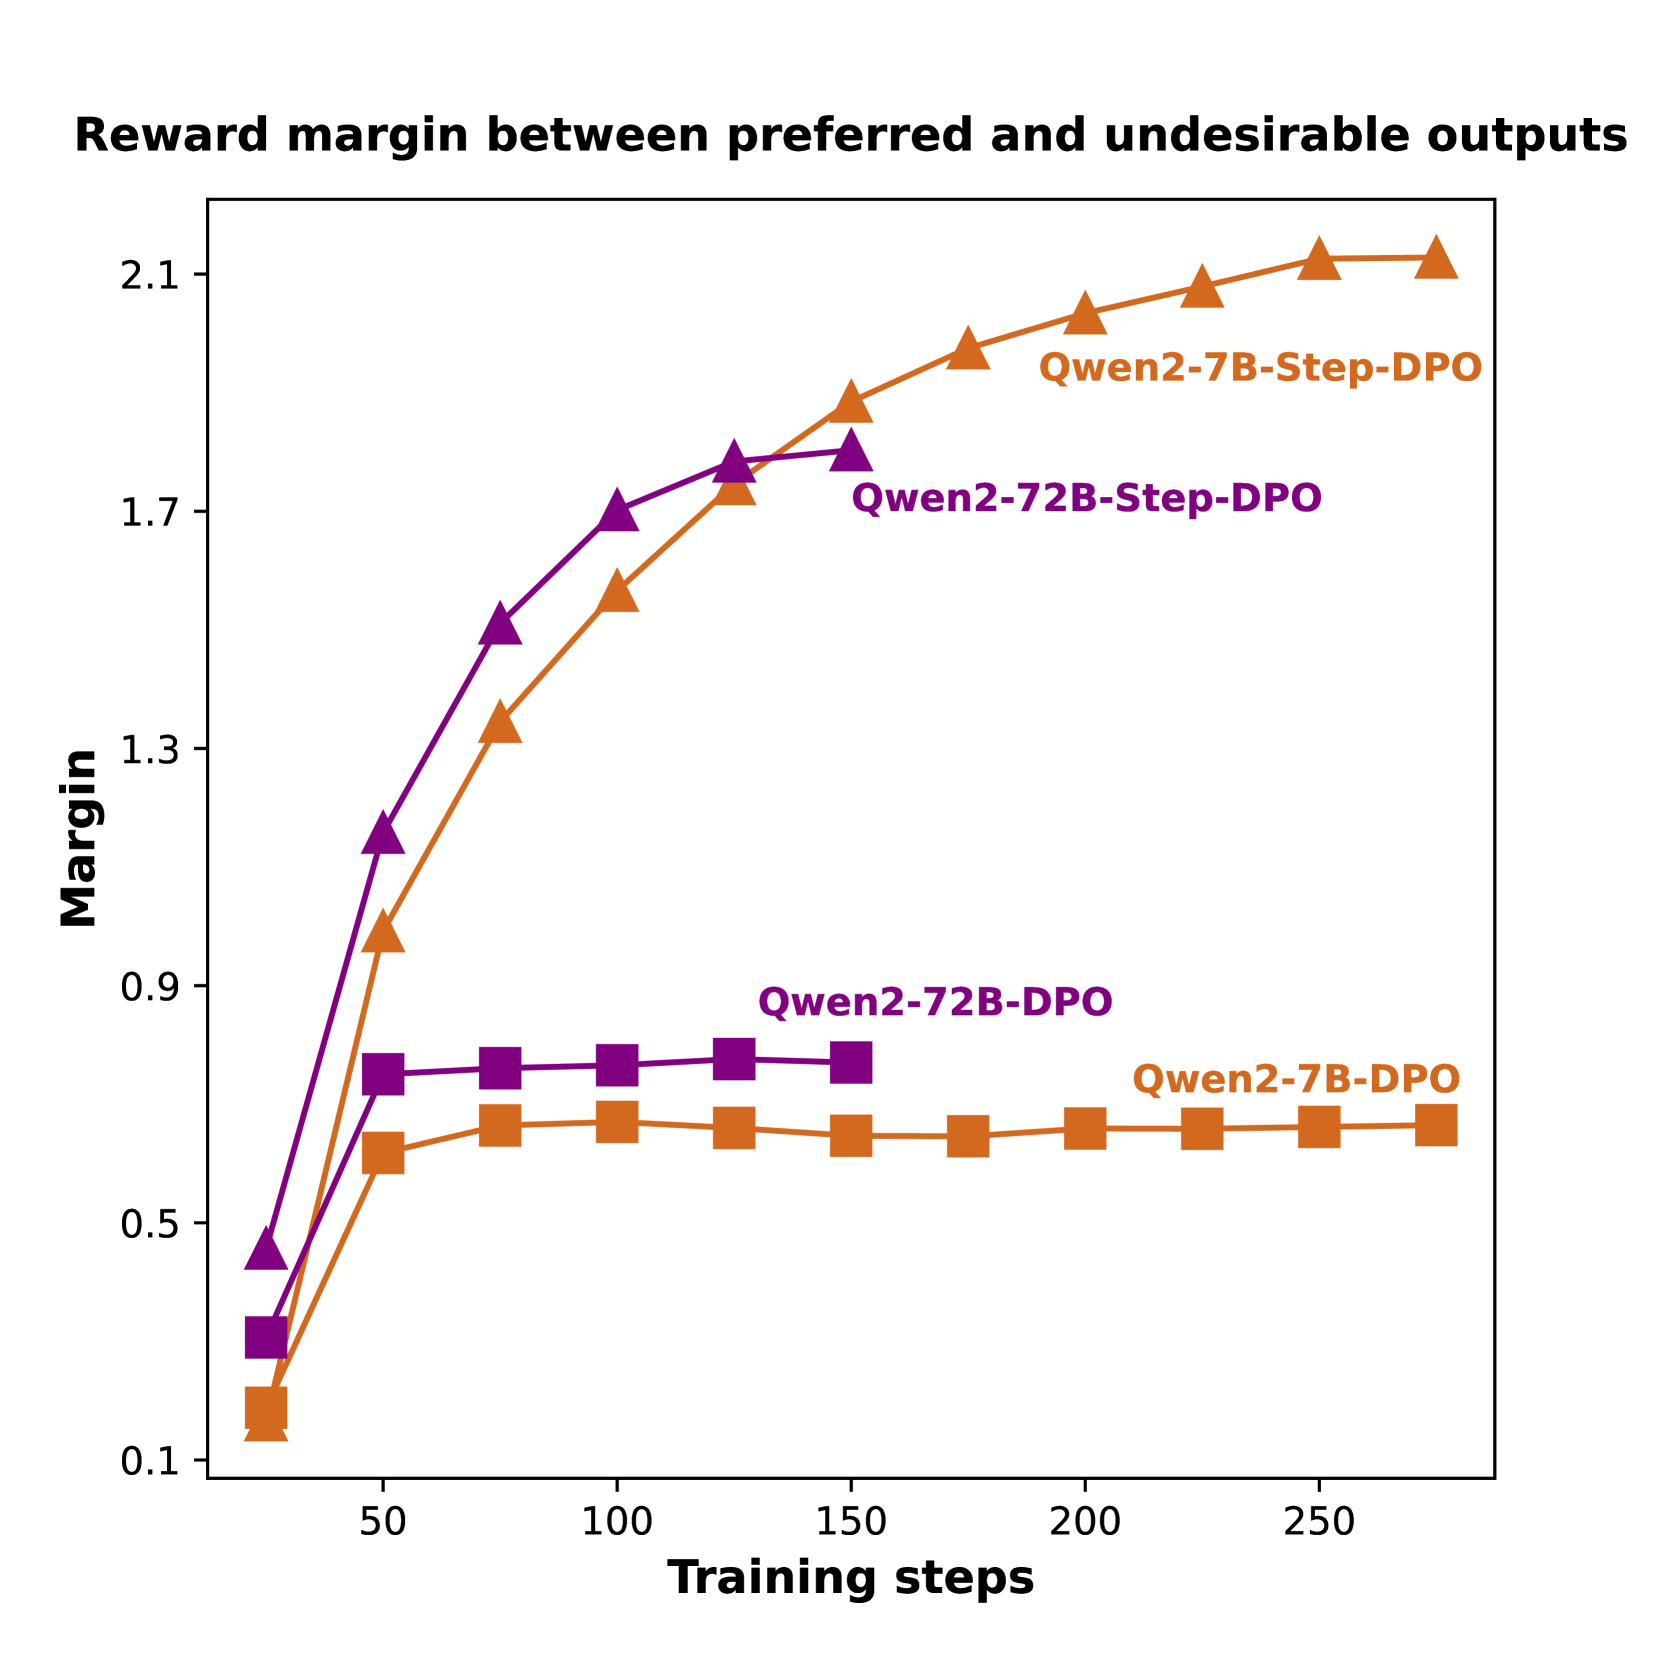
This line chart visualizes the reward margin between preferred and undesirable outputs as a function of training steps for different model configurations. The chart compares the performance of Qwen2-7B-Step-DPO, Qwen2-72B-Step-DPO, Qwen2-72B-DPO, and Qwen2-7B-DPO models.
### Components/Axes
* **Title:** "Reward margin between preferred and undesirable outputs" (Top-center)
* **X-axis:** "Training steps" (Bottom-center), ranging from 0 to 250, with markers at 0, 50, 100, 150, 200, and 250.
* **Y-axis:** "Margin" (Left-center), ranging from 0.1 to 2.1, with markers at 0.1, 0.5, 0.9, 1.3, 1.7, and 2.1.
* **Legend:** Located in the top-right corner, identifying each line with its corresponding model name and color.
* Qwen2-7B-Step-DPO (Orange)
* Qwen2-72B-Step-DPO (Purple)
* Qwen2-72B-DPO (Dark Green)
* Qwen2-7B-DPO (Brown)
### Detailed Analysis
The chart displays four distinct lines, each representing a different model's reward margin over training steps.
* **Qwen2-7B-Step-DPO (Orange):** This line shows a steep upward trend initially, rapidly increasing from approximately 0.1 at 0 training steps to around 1.8 at 100 training steps. The increase slows down after 100 steps, reaching approximately 2.0 at 250 training steps.
* 0 steps: ~0.1
* 50 steps: ~1.0
* 100 steps: ~1.8
* 150 steps: ~1.9
* 200 steps: ~2.0
* 250 steps: ~2.0
* **Qwen2-72B-Step-DPO (Purple):** This line also exhibits an upward trend, but it is less steep than the orange line. It starts at approximately 0.1 at 0 training steps and reaches around 1.7 at 100 training steps, then plateaus around 1.8-1.9 for the remaining training steps.
* 0 steps: ~0.1
* 50 steps: ~1.3
* 100 steps: ~1.7
* 150 steps: ~1.8
* 200 steps: ~1.8
* 250 steps: ~1.9
* **Qwen2-72B-DPO (Dark Green):** This line shows a relatively flat trend. It starts at approximately 0.5 at 0 training steps and remains relatively stable around 0.7-0.8 throughout the training process, reaching approximately 0.8 at 250 training steps.
* 0 steps: ~0.5
* 50 steps: ~0.7
* 100 steps: ~0.7
* 150 steps: ~0.7
* 200 steps: ~0.7
* 250 steps: ~0.8
* **Qwen2-7B-DPO (Brown):** This line shows a moderate upward trend, starting at approximately 0.1 at 0 training steps and reaching around 0.7 at 100 training steps. It then plateaus around 0.7-0.8 for the remaining training steps.
* 0 steps: ~0.1
* 50 steps: ~0.5
* 100 steps: ~0.7
* 150 steps: ~0.7
* 200 steps: ~0.7
* 250 steps: ~0.7
### Key Observations
* Qwen2-7B-Step-DPO consistently outperforms the other models, achieving the highest reward margin.
* Qwen2-72B-Step-DPO performs better than Qwen2-72B-DPO and Qwen2-7B-DPO.
* Qwen2-72B-DPO and Qwen2-7B-DPO exhibit similar performance, with relatively flat reward margins.
* The reward margin for Qwen2-7B-Step-DPO and Qwen2-72B-Step-DPO appears to converge after approximately 150 training steps.
### Interpretation
The data suggests that incorporating "Step-DPO" into the training process significantly improves the reward margin, particularly for the Qwen2-7B model. The higher reward margin indicates that the model is better at distinguishing between preferred and undesirable outputs. The plateauing of the reward margin for Qwen2-72B-DPO and Qwen2-7B-DPO suggests that further training may not yield substantial improvements. The difference in performance between the 7B and 72B models, even with the same training method (Step-DPO), indicates that model size also plays a role in achieving higher reward margins. The convergence of the Step-DPO models suggests a potential saturation point in the learning process, where additional training steps provide diminishing returns. This data is valuable for understanding the effectiveness of different training strategies and model configurations in improving the quality of generated outputs.