\n
## Line Chart: Reward Margin Between Preferred and Undesirable Outputs
### Overview
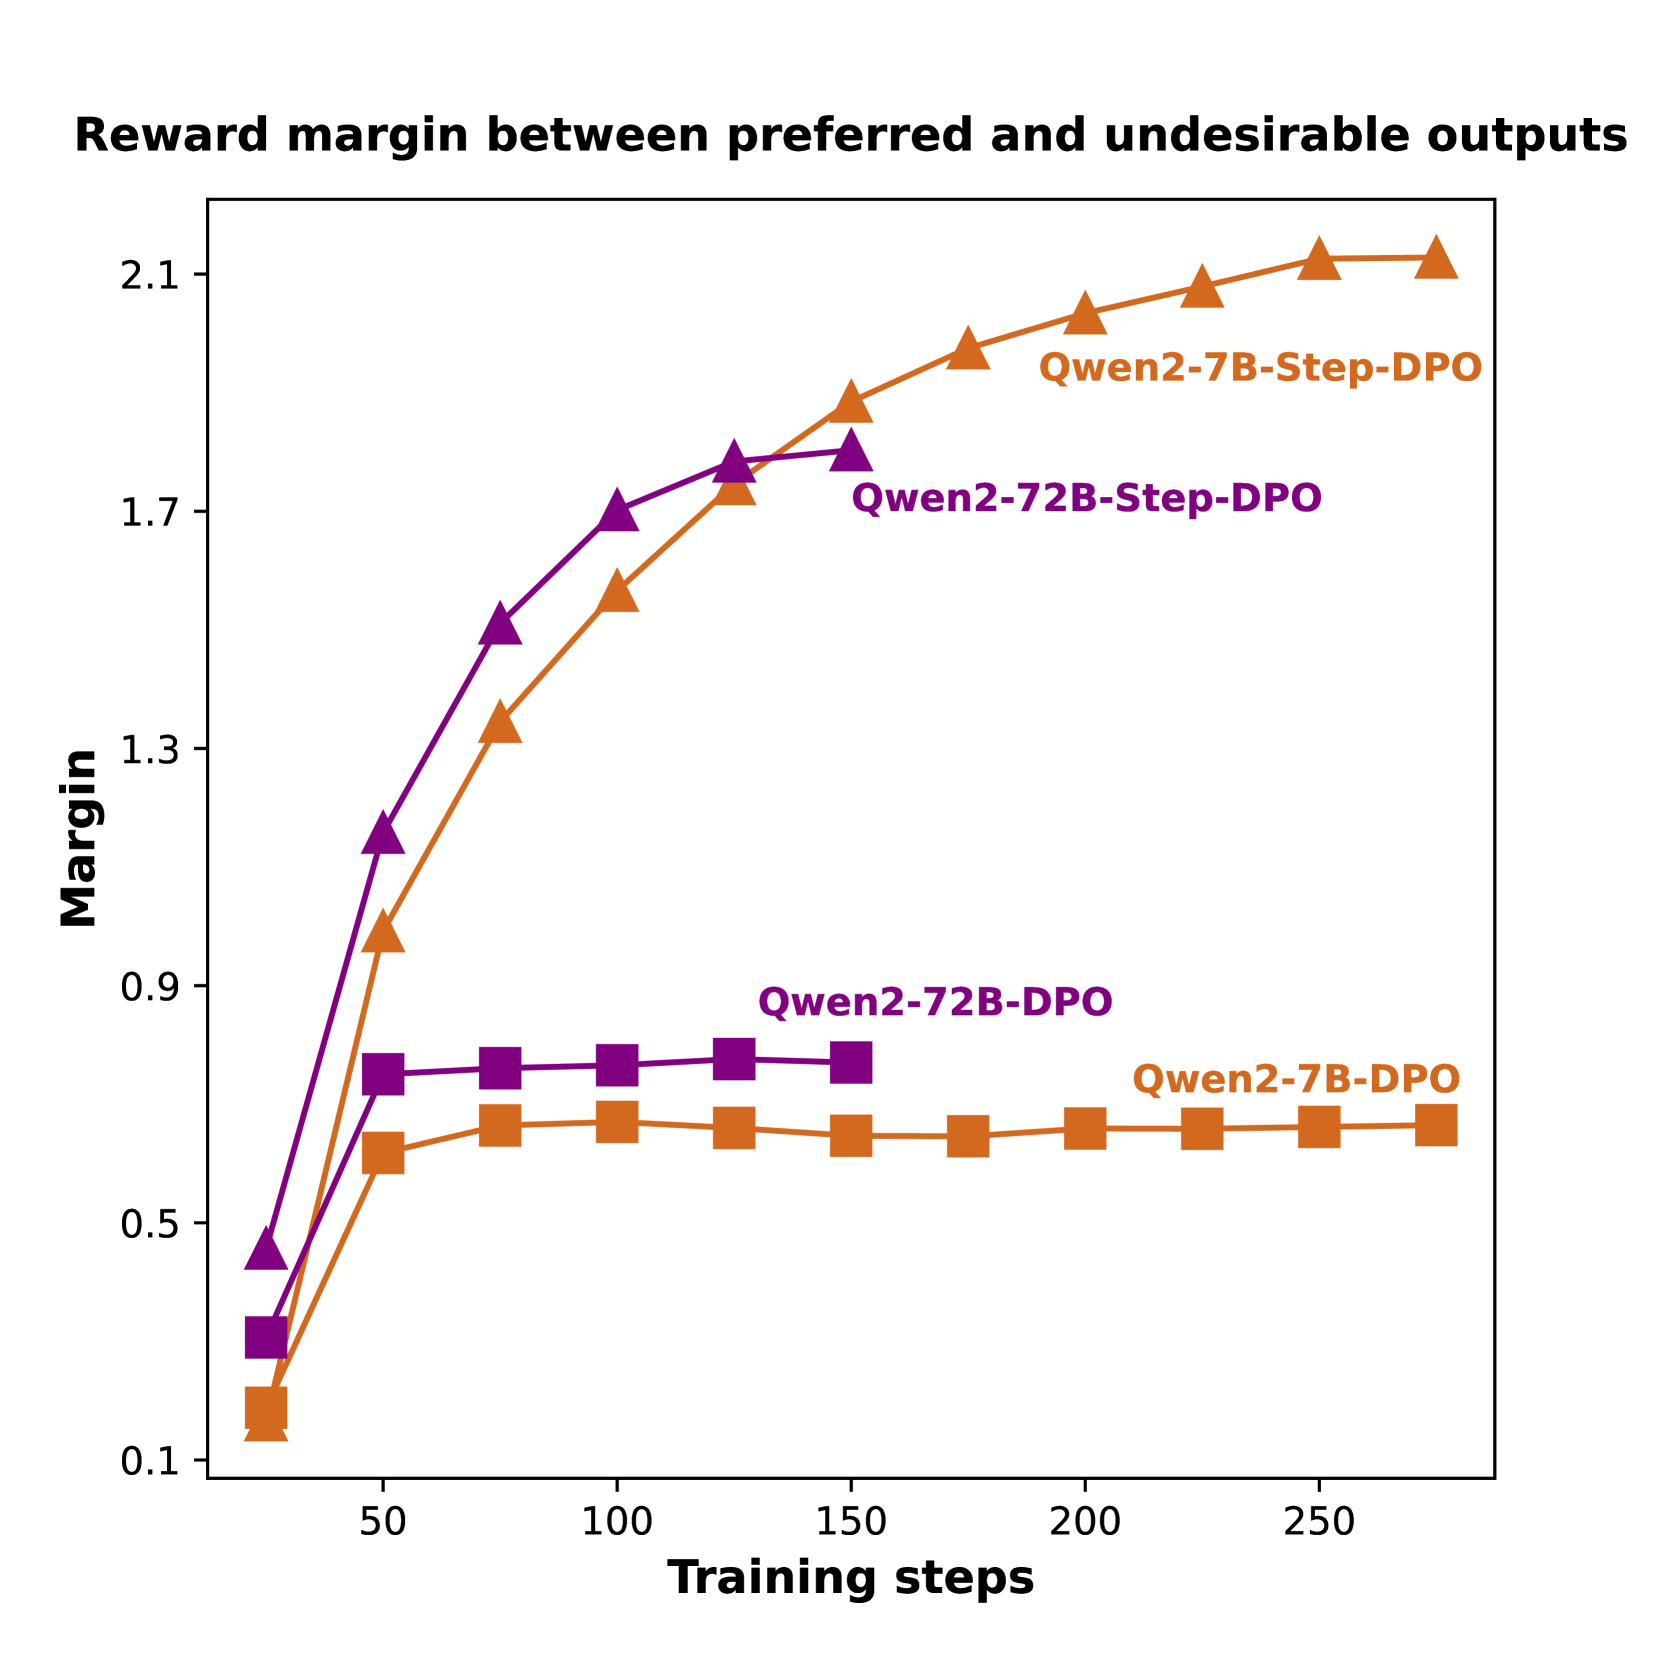
This image is a line chart comparing the performance of four different model training configurations over time. The chart tracks the "Reward margin" (y-axis) as a function of "Training steps" (x-axis). The data suggests an evaluation of Direct Preference Optimization (DPO) and a variant called "Step-DPO" applied to two different model sizes (7B and 72B parameters) from the Qwen2 series.
### Components/Axes
* **Chart Title:** "Reward margin between preferred and undesirable outputs" (top center).
* **Y-Axis:** Labeled "Margin". The scale is linear, ranging from 0.1 to 2.1, with major tick marks at 0.1, 0.5, 0.9, 1.3, 1.7, and 2.1.
* **X-Axis:** Labeled "Training steps". The scale is linear, ranging from approximately 0 to 275, with major tick marks at 50, 100, 150, 200, and 250.
* **Legend/Series Labels:** There are four distinct data series, each identified by a unique color and marker shape. The labels are placed directly on the chart near the end of their respective lines.
1. **Qwen2-7B-Step-DPO:** Orange line with upward-pointing triangle markers (▲).
2. **Qwen2-72B-Step-DPO:** Purple line with upward-pointing triangle markers (▲).
3. **Qwen2-72B-DPO:** Purple line with square markers (■).
4. **Qwen2-7B-DPO:** Orange line with square markers (■).
### Detailed Analysis
**Trend Verification & Data Point Extraction (Approximate Values):**
* **Qwen2-7B-Step-DPO (Orange Triangles):**
* **Trend:** Shows a strong, continuous upward slope that begins to plateau after step 200. It achieves the highest final margin.
* **Data Points:** (~25 steps, 0.2), (~50, 1.0), (~75, 1.35), (~100, 1.55), (~125, 1.75), (~150, 1.85), (~175, 1.95), (~200, 2.05), (~225, 2.08), (~250, 2.12), (~275, 2.12).
* **Qwen2-72B-Step-DPO (Purple Triangles):**
* **Trend:** Shows a very steep initial increase, then continues to rise steadily but at a slower rate than the 7B Step-DPO model after ~100 steps. It ends at the second-highest margin.
* **Data Points:** (~25 steps, 0.45), (~50, 1.15), (~75, 1.5), (~100, 1.7), (~125, 1.78), (~150, 1.8).
* **Qwen2-72B-DPO (Purple Squares):**
* **Trend:** Shows a rapid initial increase up to ~50 steps, after which it plateaus completely, showing almost no further improvement.
* **Data Points:** (~25 steps, 0.3), (~50, 0.75), (~75, 0.76), (~100, 0.77), (~125, 0.78), (~150, 0.77).
* **Qwen2-7B-DPO (Orange Squares):**
* **Trend:** Similar to its 72B counterpart, it rises quickly until ~50 steps and then plateaus at a margin slightly lower than the 72B DPO model.
* **Data Points:** (~25 steps, 0.15), (~50, 0.65), (~75, 0.7), (~100, 0.71), (~125, 0.69), (~150, 0.68), (~175, 0.68), (~200, 0.7), (~225, 0.7), (~250, 0.7), (~275, 0.7).
### Key Observations
1. **Step-DPO Superiority:** Both "Step-DPO" variants (triangle markers) significantly and consistently outperform their standard "DPO" counterparts (square markers) throughout the training process, achieving much higher final reward margins.
2. **Model Size Effect within Step-DPO:** The smaller 7B model (Qwen2-7B-Step-DPO) ultimately achieves a higher reward margin (~2.12) than the larger 72B model (~1.8) when using the Step-DPO method, despite a slightly slower start.
3. **Plateauing of Standard DPO:** Both standard DPO models (Qwen2-7B-DPO and Qwen2-72B-DPO) show a clear performance plateau after approximately 50 training steps, indicating that further training under this method yields negligible improvement in the reward margin.
4. **Initial Learning Rate:** The 72B Step-DPO model shows the fastest initial learning (steepest slope between 0-50 steps), but is eventually overtaken by the 7B Step-DPO model.
### Interpretation
The data demonstrates a clear comparative advantage for the "Step-DPO" training methodology over standard DPO for the task of maximizing the reward margin between preferred and undesirable outputs in the Qwen2 model series. The reward margin is a key metric in preference learning, indicating how strongly the model can distinguish between good and bad responses.
The most notable finding is the inverse relationship between model size and final performance *within the Step-DPO method*: the 7B model outperforms the 72B model. This could suggest several possibilities: the Step-DPO algorithm may be more sample-efficient or stable for smaller models, the larger model may require different hyperparameters, or the evaluation task may not benefit from, or could even be hindered by, the increased capacity of the 72B model under this specific training regime.
The complete plateau of the standard DPO models suggests a fundamental limitation in that approach for this metric, as it fails to continue improving the model's discriminative ability after an initial phase. In contrast, Step-DPO enables continued learning and refinement over hundreds of steps. This chart provides strong empirical evidence for the efficacy of the Step-DPO technique and highlights the importance of considering the interaction between training methodology and model scale.