## Line Chart: Reward margin between preferred and undesirable outputs
### Overview
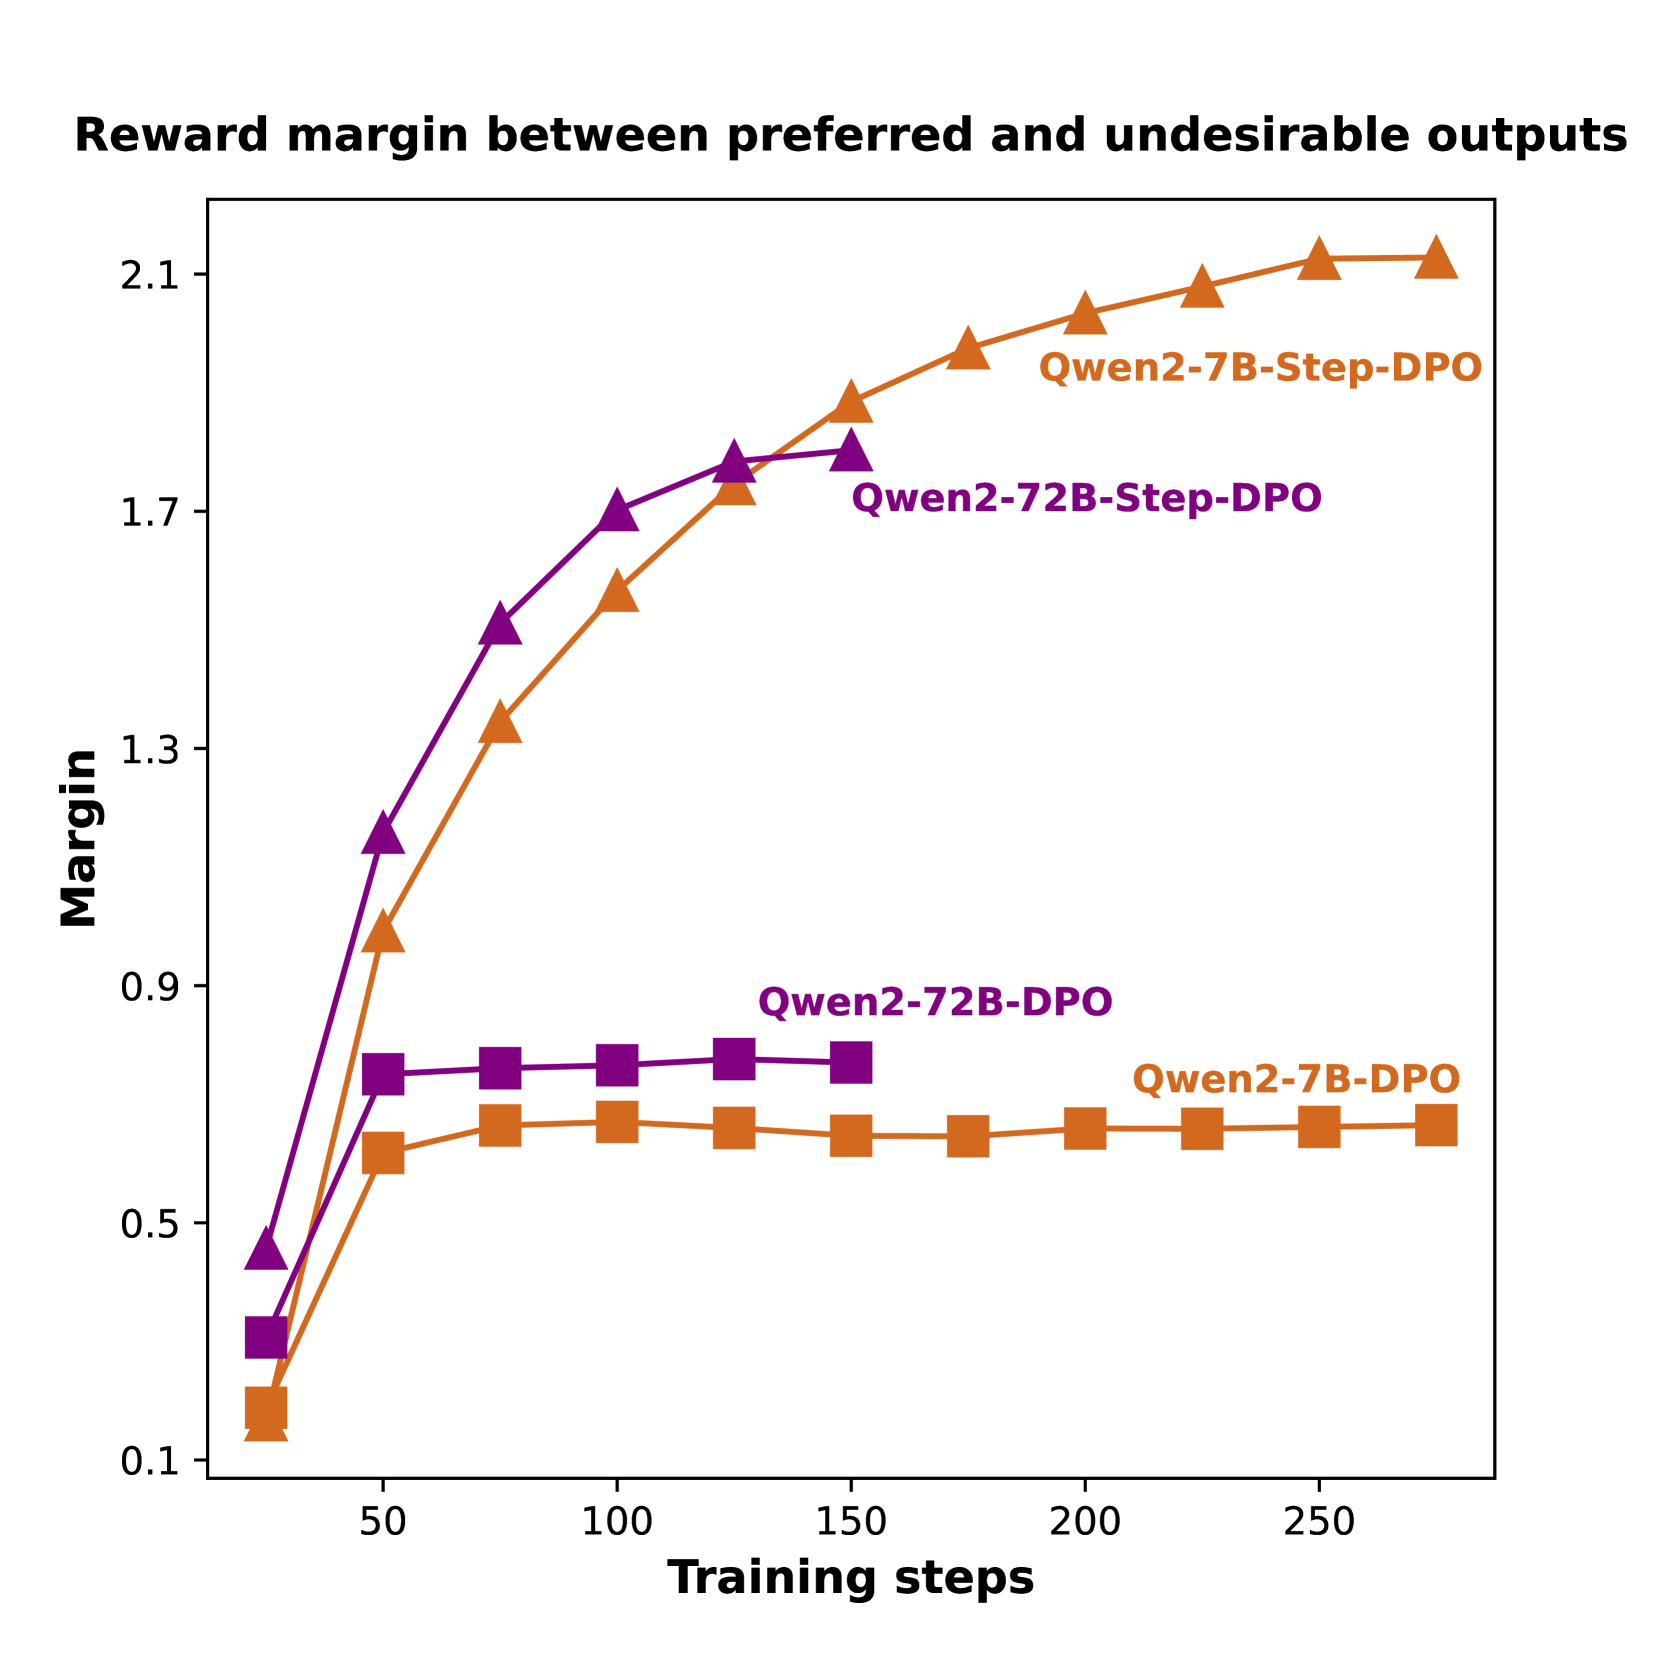
The chart illustrates the reward margin between preferred and undesirable outputs across three model configurations (Qwen2-7B-Step-DPO, Qwen2-72B-Step-DPO, Qwen2-7B-DPO) as a function of training steps. The y-axis represents the margin (0.1–2.1), while the x-axis shows training steps (0–250). Three distinct data series are plotted with different markers and colors.
### Components/Axes
- **X-axis (Training steps)**: Labeled "Training steps" with markers at 0, 50, 100, 150, 200, 250.
- **Y-axis (Margin)**: Labeled "Margin" with values 0.1, 0.5, 0.9, 1.3, 1.7, 2.1.
- **Legend**: Located in the top-right corner, with three entries:
- **Orange triangles**: Qwen2-7B-Step-DPO
- **Purple triangles**: Qwen2-72B-Step-DPO
- **Orange squares**: Qwen2-7B-DPO
### Detailed Analysis
1. **Qwen2-7B-Step-DPO (Orange triangles)**:
- Starts at ~0.1 (training step 0).
- Increases steadily to ~2.1 by 250 steps.
- Key data points: 0.1 (0 steps), 0.9 (50 steps), 1.3 (100 steps), 1.7 (150 steps), 2.1 (200 steps), 2.1 (250 steps).
2. **Qwen2-72B-Step-DPO (Purple triangles)**:
- Starts at ~0.4 (training step 0).
- Rises to ~1.7 by 150 steps, then plateaus.
- Key data points: 0.4 (0 steps), 1.3 (100 steps), 1.7 (150 steps), 1.7 (200 steps), 1.7 (250 steps).
3. **Qwen2-7B-DPO (Orange squares)**:
- Starts at ~0.1 (training step 0).
- Rises to ~0.6–0.7 and remains flat.
- Key data points: 0.1 (0 steps), 0.6 (50 steps), 0.7 (100 steps), 0.6 (150 steps), 0.7 (200 steps), 0.7 (250 steps).
### Key Observations
- **Qwen2-7B-Step-DPO** achieves the highest margin, surpassing all other configurations.
- **Qwen2-72B-Step-DPO** outperforms the baseline Qwen2-72B-DPO but lags behind the 7B-Step-DPO.
- **Qwen2-7B-DPO** shows minimal improvement over training steps, remaining near 0.6–0.7.
### Interpretation
The data suggests that the **Step-DPO** training method significantly improves the reward margin compared to standard DPO. The 7B-Step-DPO configuration demonstrates the most substantial gains, indicating that smaller models may benefit more from this approach. The 72B-Step-DPO, while better than its baseline, does not match the 7B-Step-DPO's performance, possibly due to model complexity or other architectural factors. The flat trend of Qwen2-7B-DPO highlights the importance of the Step-DPO technique for optimizing reward margins.