## Chart/Diagram Type: Classification Method Visualization
### Overview
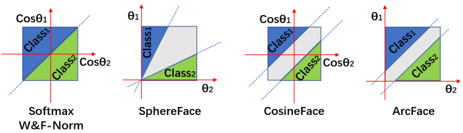
The image presents four comparative diagrams illustrating decision boundaries for different classification methods: **Softmax**, **SphereFace**, **CosineFace**, and **ArcFace**. Each diagram uses a 2D coordinate system with axes labeled **θ₁** and **θ₂**, and includes axis markers **Cosθ₁** and **Cosθ₂**. The regions are color-coded (blue for **Class1**, green for **Class2**) and labeled with a **W&F-Norm** (Weighted & Frobenius Norm) in the bottom-left corner.
### Components/Axes
- **Axes**:
- Horizontal axis: **θ₂** (labeled with **Cosθ₂** as a marker).
- Vertical axis: **θ₁** (labeled with **Cosθ₁** as a marker).
- **Legend**:
- Located at the **bottom-left** of the entire image.
- **Blue**: Class1.
- **Green**: Class2.
- **W&F-Norm**: Positioned in the **bottom-left corner** of all diagrams, suggesting a shared normalization framework.
### Detailed Analysis
1. **Softmax**:
- Decision boundary: Diagonal line from top-left to bottom-right.
- Class1 (blue) occupies the upper-left triangular region.
- Class2 (green) occupies the lower-right triangular region.
2. **SphereFace**:
- Decision boundary: Vertical line splitting the diagram into left (Class1) and right (Class2).
- Class1 (blue) occupies the left half.
- Class2 (green) occupies the right half.
3. **CosineFace**:
- Decision boundary: Diagonal line with a steeper slope than Softmax.
- Class1 (blue) occupies the upper-left region.
- Class2 (green) occupies the lower-right region.
4. **ArcFace**:
- Decision boundary: Horizontal line splitting the diagram into top (Class1) and bottom (Class2).
- Class1 (blue) occupies the upper half.
- Class2 (green) occupies the lower half.
### Key Observations
- **Consistency**: All diagrams use identical color coding (blue for Class1, green for Class2) and axis labels.
- **Boundary Variations**:
- Softmax and CosineFace use diagonal boundaries but with differing slopes.
- SphereFace uses a vertical boundary, while ArcFace uses a horizontal boundary.
- **W&F-Norm**: Appears to standardize the coordinate system across methods.
### Interpretation
The diagrams highlight how each method partitions the feature space:
- **Softmax** and **CosineFace** rely on linear separability but differ in margin optimization (e.g., CosineFace’s steeper slope may reflect angular margin maximization).
- **SphereFace**’s vertical boundary suggests a spherical projection of features, emphasizing distance in a transformed space.
- **ArcFace**’s horizontal boundary aligns with its focus on maximizing angular margins between classes, a key characteristic of its loss function.
- The **W&F-Norm** likely ensures comparability by normalizing feature vectors, enabling fair evaluation across methods.
No numerical data or outliers are present; the focus is on geometric decision boundaries. The diagrams emphasize methodological differences in feature space partitioning rather than quantitative performance metrics.