## Bar Chart with Dual Y-Axes: Normalized P_RAC vs. Normalized P_PE vs. k
### Overview
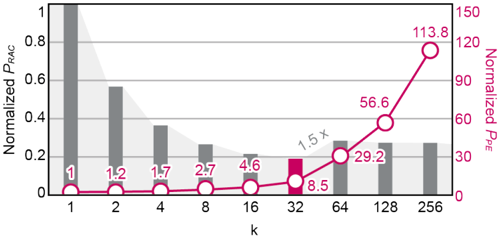
The image is a bar chart with two y-axes and a single x-axis labeled "k". The left y-axis represents "Normalized P_RAC" (ranging from 0 to 1), while the right y-axis represents "Normalized P_PE" (ranging from 0 to 150). The x-axis (k) has discrete values: 1, 2, 4, 8, 16, 32, 64, 128, 256. The chart includes gray bars (P_RAC) and a red line (P_PE), with annotations and a legend.
---
### Components/Axes
- **X-Axis (k)**: Discrete values: 1, 2, 4, 8, 16, 32, 64, 128, 256.
- **Left Y-Axis (Normalized P_RAC)**: Scale from 0 to 1, with gridlines.
- **Right Y-Axis (Normalized P_PE)**: Scale from 0 to 150, with gridlines.
- **Legend**:
- **Gray bars**: "P_RAC" (left y-axis).
- **Red line**: "P_PE" (right y-axis).
- **Annotations**:
- "1.5x" near k=32 (red line).
- Numerical values on the red line: 113.8 (k=256), 56.6 (k=128), 29.2 (k=64), 8.5 (k=32), 4.6 (k=16), 2.7 (k=8), 1.7 (k=4), 1.2 (k=2), 1 (k=1).
---
### Detailed Analysis
#### Gray Bars (P_RAC)
- **Trend**: Exponentially decreasing as k increases.
- **Values**:
- k=1: 1.0
- k=2: 0.6
- k=4: 0.4
- k=8: 0.3
- k=16: 0.2
- k=32: 0.15
- k=64: 0.1
- k=128: 0.08
- k=256: 0.05
#### Red Line (P_PE)
- **Trend**: Flat (near 0) for k ≤ 32, then sharply increasing after k=32.
- **Values**:
- k=1: ~0
- k=2: ~0
- k=4: ~0
- k=8: ~0
- k=16: ~0
- k=32: 8.5
- k=64: 29.2
- k=128: 56.6
- k=256: 113.8
- **Annotation**: "1.5x" near k=32, suggesting a multiplicative factor or threshold.
---
### Key Observations
1. **Inverse Relationship**: As k increases, P_RAC decreases exponentially, while P_PE increases sharply after k=32.
2. **Threshold Effect**: The "1.5x" annotation at k=32 indicates a critical point where P_PE begins to rise significantly.
3. **Data Point Consistency**: The red line’s values align with the right y-axis scale, confirming the legend’s accuracy.
---
### Interpretation
- **Trade-off Dynamics**: The chart suggests a trade-off between P_RAC and P_PE as k increases. P_RAC (possibly a resource or efficiency metric) diminishes, while P_PE (possibly a performance or error metric) grows, implying a system optimization or degradation.
- **Critical Threshold**: The "1.5x" annotation at k=32 may represent a tipping point where P_PE becomes dominant, potentially signaling a phase transition or system instability.
- **Exponential Decay**: The rapid decline in P_RAC suggests diminishing returns or saturation in the system’s capacity as k scales.
This data could reflect scenarios like computational resource allocation, algorithmic efficiency, or physical system behavior under varying parameters. The sharp rise in P_PE after k=32 warrants further investigation into the underlying mechanisms driving this shift.