## Neural Network and Chip Implementation Diagram with Performance Chart
### Overview
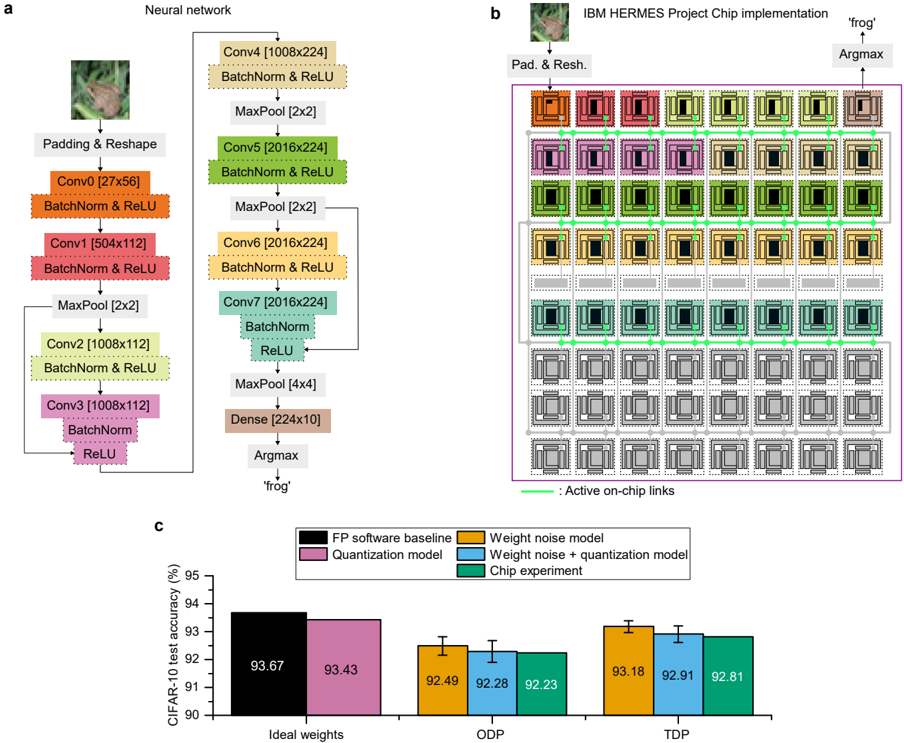
The image presents a neural network architecture, its chip implementation, and a performance comparison chart. Part (a) illustrates the neural network structure, part (b) shows the chip implementation of the network, and part (c) compares the CIFAR-10 test accuracy of different models (FP software baseline, quantization model, weight noise model, weight noise + quantization model, and chip experiment) under different conditions (Ideal weights, ODP, TDP).
### Components/Axes
**Part (a): Neural Network**
* **Title:** Neural network
* **Input:** Image of a frog
* **Layers:**
* Padding & Reshape
* Conv0 [27x56] + BatchNorm & ReLU
* Conv1 [504x112] + BatchNorm & ReLU
* MaxPool [2x2]
* Conv2 [1008x112] + BatchNorm & ReLU
* Conv3 [1008x112] + BatchNorm & ReLU
* Conv4 [1008x224] + BatchNorm & ReLU
* MaxPool [2x2]
* Conv5 [2016x224] + BatchNorm & ReLU
* MaxPool [2x2]
* Conv6 [2016x224] + BatchNorm & ReLU
* Conv7 [2016x224] + BatchNorm & ReLU
* MaxPool [4x4]
* Dense [224x10]
* Argmax
* **Output:** 'frog'
**Part (b): IBM HERMES Project Chip Implementation**
* **Title:** IBM HERMES Project Chip implementation
* **Input:** Image of a frog, Pad. & Resh.
* **Output:** Argmax -> 'frog'
* **Chip Structure:** A grid of processing units, with different units highlighted in colors corresponding to the layers in part (a).
* **Active on-chip links:** Indicated by green lines connecting the processing units.
* The entire chip is enclosed in a purple box.
**Part (c): CIFAR-10 Test Accuracy Chart**
* **Title:** CIFAR-10 test accuracy (%)
* **Y-axis:** CIFAR-10 test accuracy (%), ranging from 90 to 95.
* **X-axis:** Categorical labels: Ideal weights, ODP, TDP.
* **Legend (located in the top-right):**
* Black: FP software baseline
* Pink: Quantization model
* Orange: Weight noise model
* Purple: Weight noise + quantization model
* Teal: Chip experiment
### Detailed Analysis or ### Content Details
**Part (a): Neural Network**
The neural network consists of convolutional layers (Conv), batch normalization (BatchNorm), ReLU activation functions, max pooling layers (MaxPool), and a dense layer. The input image undergoes padding and reshaping before being processed by the convolutional layers. The dimensions of each layer are indicated in brackets (e.g., Conv0 [27x56]).
**Part (b): IBM HERMES Project Chip Implementation**
The chip implementation shows a grid of processing units, with connections between them. The colors of the units correspond to the layers in the neural network architecture. The green lines indicate active on-chip links.
**Part (c): CIFAR-10 Test Accuracy Chart**
The chart compares the performance of different models on the CIFAR-10 dataset.
* **Ideal weights:**
* FP software baseline (Black): 93.67%
* Quantization model (Pink): 93.43%
* **ODP:**
* Weight noise model (Orange): 92.49% +/- 0.2%
* Weight noise + quantization model (Purple): 92.28% +/- 0.2%
* Chip experiment (Teal): 92.23% +/- 0.2%
* **TDP:**
* Weight noise model (Orange): 93.18% +/- 0.2%
* Weight noise + quantization model (Purple): 92.91% +/- 0.2%
* Chip experiment (Teal): 92.81% +/- 0.2%
### Key Observations
* The FP software baseline and quantization model achieve the highest accuracy with ideal weights.
* The accuracy decreases when weight noise is introduced (ODP and TDP).
* The chip experiment performance is comparable to the weight noise and quantization models.
* The error bars on the ODP and TDP groups are small, indicating low variance.
### Interpretation
The data suggests that the chip implementation achieves comparable performance to software models with weight noise and quantization. The ideal weight models (FP software baseline and quantization model) perform better, indicating that the chip implementation introduces some level of noise or approximation. The chart demonstrates the impact of weight noise and quantization on the accuracy of the neural network and provides a comparison of the chip implementation's performance against these models. The neural network diagram shows the flow of data and the transformations applied to the input image. The chip implementation diagram shows how the neural network is mapped onto the hardware.