## Neural Network Architecture and Chip Implementation with Performance Analysis
### Overview
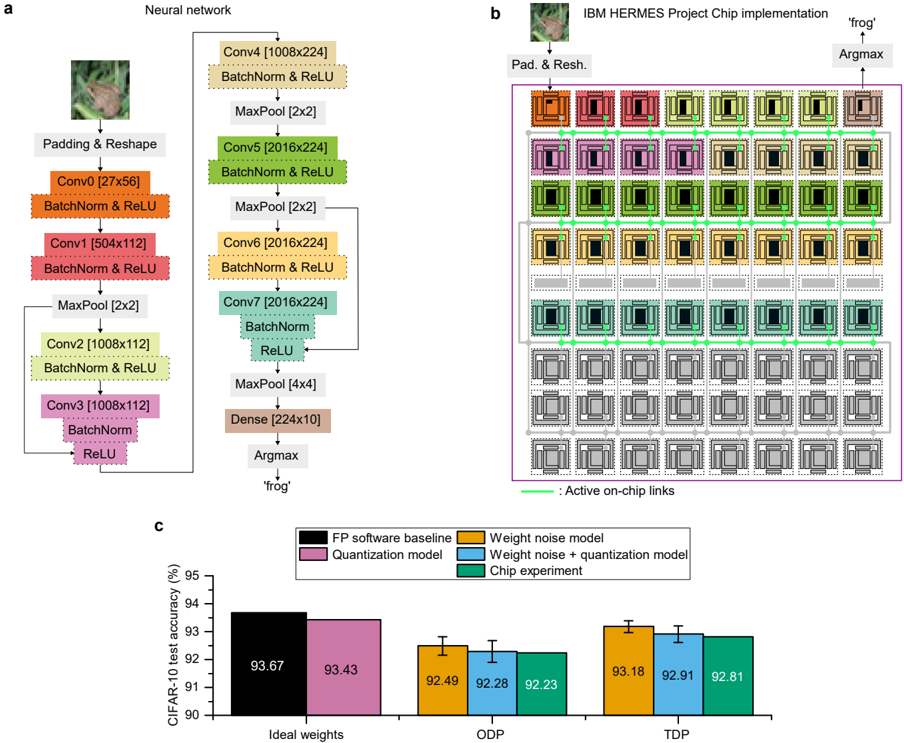
The image presents three interconnected components:
1. A detailed neural network architecture diagram (a)
2. A physical chip implementation layout (b)
3. A performance comparison bar chart (c)
The system appears to be a convolutional neural network (CNN) for image classification, implemented on an IBM HERMES Project Chip, with performance metrics shown for different operational modes.
### Components/Axes
**a) Neural Network Architecture**
- **Input**: 224x224 RGB image (frog example shown)
- **Layers**:
- Conv0 (27x56) → BatchNorm → ReLU
- Conv1 (504x112) → BatchNorm → ReLU
- MaxPool (2x2)
- Conv2 (1008x112) → BatchNorm → ReLU
- Conv3 (1008x112) → BatchNorm → ReLU
- MaxPool (4x4)
- Dense (224x10) → Argmax → "frog" output
**b) IBM HERMES Project Chip Implementation**
- **Layout**: 5x5 grid of processing units (PUs)
- **Color Coding**:
- Orange: Conv0/Conv1
- Purple: Conv2/Conv3
- Green: BatchNorm/ReLU
- Gray: MaxPool/Dense
- **Active Links**: Green lines connecting PUs
- **Output**: Argmax operation identifying "frog" class
**c) Performance Comparison Chart**
- **X-axis**: Model configurations (Ideal weights, ODP, TDP)
- **Y-axis**: CIFAR-10 test accuracy (%)
- **Legend**:
- Black: FP software baseline
- Purple: Quantization model
- Orange: Weight noise model
- Blue: Weight noise + quantization model
- Green: Chip experiment
### Detailed Analysis
**a) Neural Network Architecture**
- Sequential CNN with 3 convolutional layers and 2 dense layers
- Batch normalization and ReLU activation after each convolution
- MaxPooling layers reduce spatial dimensions progressively
- Final dense layer outputs 10-class probabilities
**b) Chip Implementation**
- 25 PUs arranged in 5x5 grid with active on-chip links (green)
- Color-coded PUs correspond to specific network layers
- Physical implementation mirrors logical network structure
- Argmax operation localized to final PU cluster
**c) Performance Metrics**
| Configuration | Accuracy (%) |
|-----------------------------|--------------|
| FP software baseline | 93.67 |
| Quantization model | 93.43 |
| Weight noise model | 92.49 |
| Weight noise + quantization | 92.28 |
| Chip experiment | 92.23 |
| ODP mode | 92.91 |
| TDP mode | 92.81 |
### Key Observations
1. **Accuracy Degradation**: All implementations show <1% accuracy drop vs FP baseline
2. **Chip Performance**: Chip experiment (92.23%) underperforms software baseline (93.67%)
3. **ODP/TDP Comparison**:
- ODP (92.91%) outperforms TDP (92.81%) by 0.1%
- Both modes show similar degradation patterns
4. **Quantization Impact**: Quantization alone causes minimal accuracy loss (-0.24%)
### Interpretation
The system demonstrates successful hardware-software co-design for CNN acceleration. The chip implementation maintains >92% accuracy despite physical constraints, showing promising efficiency gains. The ODP mode's slight advantage over TDP suggests dynamic power management benefits classification performance. The minimal accuracy degradation across implementations validates the effectiveness of quantization and noise-aware training strategies. However, the 1.44% accuracy gap between FP baseline and chip experiment indicates room for improvement in hardware-software co-design optimization, particularly in maintaining precision during weight quantization and on-chip computation.