## Diagram: Evidence Flow
### Overview
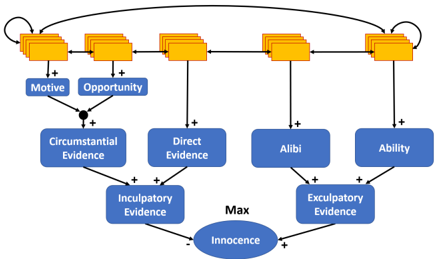
The image is a diagram illustrating the flow of evidence and its impact on determining innocence. It shows how different types of evidence (circumstantial, direct, inculpatory, exculpatory) and factors (motive, opportunity, alibi, ability) contribute to the assessment of innocence.
### Components/Axes
* **Nodes:** The diagram uses rounded rectangles (blue) and rectangles (yellow) to represent different types of evidence and factors. An oval represents "Innocence".
* **Edges:** Arrows indicate the flow and influence between the nodes. "+" and "-" symbols indicate positive or negative influence, respectively.
* **Labels:** The nodes are labeled with terms such as "Motive," "Opportunity," "Circumstantial Evidence," "Direct Evidence," "Alibi," "Ability," "Inculpatory Evidence," "Exculpatory Evidence," and "Innocence."
* **Connectors:** A black dot connects "Motive" and "Opportunity" to "Circumstantial Evidence."
* **Max:** The word "Max" is positioned above the "Innocence" oval.
### Detailed Analysis
* **Top Row:** There are four stacks of yellow rectangles connected horizontally. The first stack has a self-looping arrow. The first and second stacks feed into "Motive" and "Opportunity" respectively, both with a "+" influence. The fourth stack also has a self-looping arrow.
* **Motive and Opportunity:** "Motive" and "Opportunity" are connected to a black dot, which then connects to "Circumstantial Evidence" with a "+" influence.
* **Evidence Types:** "Circumstantial Evidence" and "Direct Evidence" are connected to "Inculpatory Evidence" with a "+" influence. "Alibi" and "Ability" are connected to "Exculpatory Evidence" with a "+" influence.
* **Innocence:** "Inculpatory Evidence" is connected to "Innocence" with a "-" influence, while "Exculpatory Evidence" is connected to "Innocence" with a "+" influence.
### Key Observations
* The diagram illustrates how various factors and evidence types contribute to the determination of innocence.
* Inculpatory evidence negatively influences innocence, while exculpatory evidence positively influences it.
* Motive and opportunity contribute to circumstantial evidence.
* Alibi and ability contribute to exculpatory evidence.
### Interpretation
The diagram represents a simplified model of how evidence is weighed in determining innocence. It suggests that innocence is influenced by a combination of factors, with inculpatory evidence decreasing the likelihood of innocence and exculpatory evidence increasing it. The "Max" label above "Innocence" suggests that innocence is maximized by the presence of exculpatory evidence and the absence of inculpatory evidence. The diagram highlights the importance of considering various types of evidence and factors when assessing guilt or innocence. The stacks of yellow rectangles at the top likely represent a timeline or sequence of events, with the self-looping arrows indicating ongoing or repetitive actions.