## Box Plot: Accuracy Comparison Across Five Task Categories
### Overview
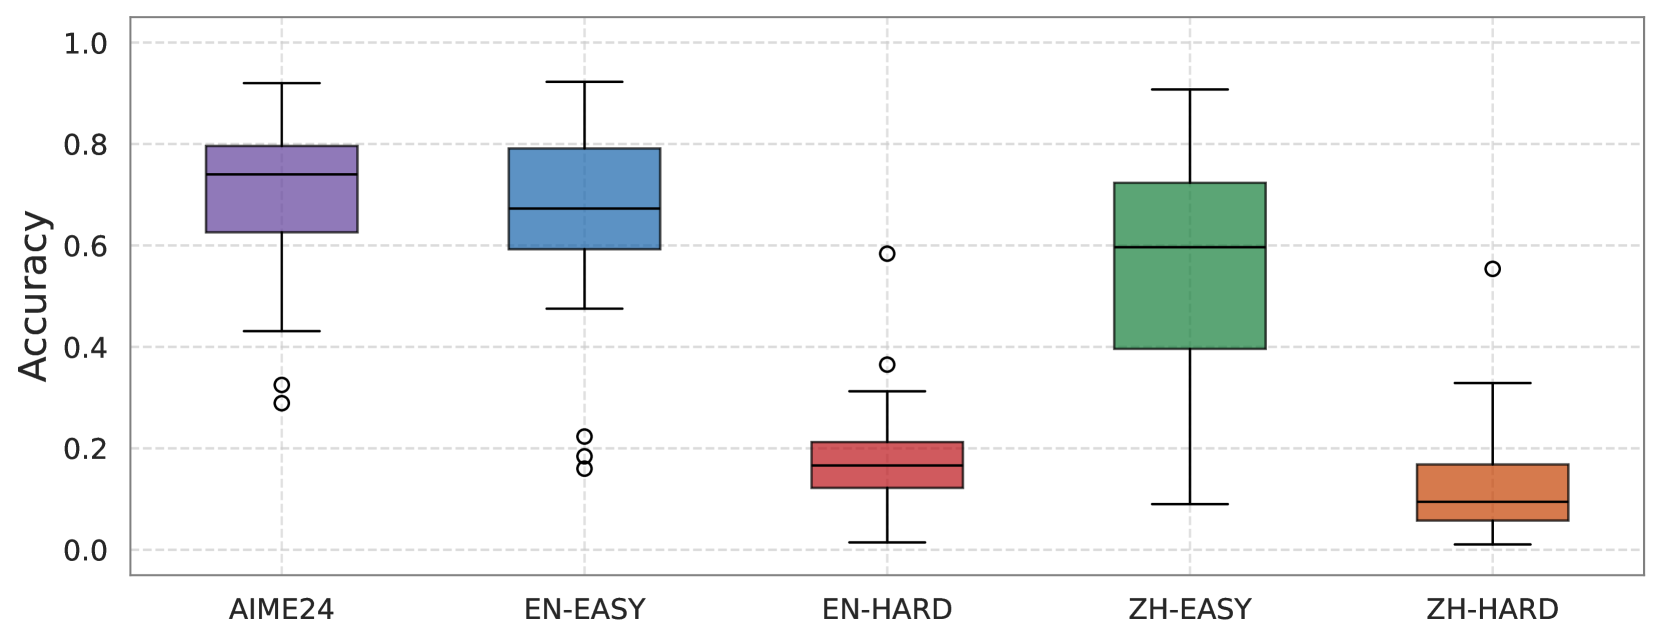
The image displays a box-and-whisker plot comparing the distribution of "Accuracy" scores across five distinct task categories. The chart is presented on a white background with a light gray grid. The plot visualizes statistical summaries (median, quartiles, range, and outliers) for each category, allowing for comparison of central tendency, spread, and performance consistency.
### Components/Axes
* **Y-Axis:** Labeled **"Accuracy"**. The scale runs from 0.0 to 1.0, with major tick marks and grid lines at intervals of 0.2 (0.0, 0.2, 0.4, 0.6, 0.8, 1.0).
* **X-Axis:** Contains five categorical labels, each corresponding to a colored box plot:
1. **AIME24** (Purple box)
2. **EN-EASY** (Blue box)
3. **EN-HARD** (Red box)
4. **ZH-EASY** (Green box)
5. **ZH-HARD** (Orange box)
* **Legend:** There is no separate legend box. The color-coding is directly associated with the x-axis category labels.
* **Plot Elements:** Each category features:
* A **box** spanning the interquartile range (IQR, from the 25th to the 75th percentile).
* A **horizontal line** inside the box marking the **median**.
* **Whiskers** extending from the box to the minimum and maximum values within 1.5 * IQR.
* **Individual circles** representing **outliers** beyond the whisker range.
### Detailed Analysis
**1. AIME24 (Purple)**
* **Median:** Approximately 0.75.
* **IQR (Box):** Spans from ~0.62 to ~0.80.
* **Whiskers:** Extend from a minimum of ~0.43 to a maximum of ~0.92.
* **Outliers:** Two distinct low-value outliers at approximately 0.32 and 0.29.
* **Trend/Spread:** Shows a relatively high median and a moderate spread. The presence of low outliers indicates some instances of significantly lower performance.
**2. EN-EASY (Blue)**
* **Median:** Approximately 0.68.
* **IQR (Box):** Spans from ~0.59 to ~0.79.
* **Whiskers:** Extend from a minimum of ~0.48 to a maximum of ~0.92.
* **Outliers:** Two low-value outliers clustered around 0.22 and 0.18.
* **Trend/Spread:** Median is slightly lower than AIME24. The box is similarly sized, indicating comparable variability in the middle 50% of data. Also features low outliers.
**3. EN-HARD (Red)**
* **Median:** Approximately 0.18.
* **IQR (Box):** Spans from ~0.12 to ~0.22.
* **Whiskers:** Extend from a minimum of ~0.02 to a maximum of ~0.32.
* **Outliers:** Two high-value outliers at approximately 0.58 and 0.36.
* **Trend/Spread:** Dramatically lower median and a much tighter IQR compared to the "EASY" categories. The overall range is low, but high outliers show rare instances of much better performance.
**4. ZH-EASY (Green)**
* **Median:** Approximately 0.60.
* **IQR (Box):** Spans from ~0.40 to ~0.72. This is the tallest box, indicating the largest IQR.
* **Whiskers:** Extend from a minimum of ~0.09 to a maximum of ~0.91. This is the widest overall range.
* **Outliers:** No visible outliers.
* **Trend/Spread:** Shows a median lower than both AIME24 and EN-EASY. The very large spread (both IQR and range) suggests highly inconsistent performance across the samples in this category.
**5. ZH-HARD (Orange)**
* **Median:** Approximately 0.10.
* **IQR (Box):** Spans from ~0.06 to ~0.17.
* **Whiskers:** Extend from a minimum of ~0.01 to a maximum of ~0.33.
* **Outliers:** One high-value outlier at approximately 0.55.
* **Trend/Spread:** Has the lowest median of all categories. The spread is relatively tight, similar to EN-HARD, but centered at an even lower accuracy level. One notable high outlier exists.
### Key Observations
1. **Clear Performance Tiering:** There is a stark divide between "EASY" and "HARD" tasks. The medians for EN-EASY (~0.68) and ZH-EASY (~0.60) are substantially higher than those for EN-HARD (~0.18) and ZH-HARD (~0.10).
2. **AIME24 Performance:** The AIME24 category performs comparably to, or slightly better than, the EN-EASY category in terms of median and upper quartile.
3. **Variability:** ZH-EASY exhibits the greatest variability in performance (widest IQR and range). EN-HARD and ZH-HARD show the least variability in their core distributions (smallest IQRs).
4. **Outlier Patterns:** Low outliers are present in the two highest-performing categories (AIME24, EN-EASY). High outliers are present in the two lowest-performing categories (EN-HARD, ZH-HARD). This suggests that while most samples follow the trend, there are exceptional cases that defy the category's general difficulty.
### Interpretation
This box plot likely compares the performance of one or more AI models on different benchmark datasets or task difficulties. The data suggests:
* **Task Difficulty is a Primary Driver:** The "HARD" designation strongly correlates with low accuracy, indicating these tasks are significantly more challenging for the evaluated system(s).
* **Language/Domain Nuance:** While both "EASY" sets outperform the "HARD" sets, the ZH-EASY (Chinese Easy) tasks show much higher variance than EN-EASY (English Easy). This could imply that the model's performance on easier Chinese tasks is less consistent, possibly due to factors like training data distribution or linguistic complexity.
* **Benchmark Context:** "AIME24" likely refers to a specific competition or benchmark (e.g., American Invitational Mathematics Examination 2024). Its performance profile aligning with EN-EASY suggests the model handles this benchmark at a level similar to general "easy" English tasks.
* **Outlier Significance:** The presence of outliers is critical. The low outliers in high-accuracy groups and high outliers in low-accuracy groups indicate that factors beyond the labeled difficulty (e.g., specific problem types, data quirks, or model failure modes) can lead to atypical results. These outliers warrant individual investigation to understand edge-case behavior.
**Language Declaration:** All text in the image is in English.