# Technical Document Extraction: Box Plot Analysis of Accuracy Across Datasets
## Figure Caption
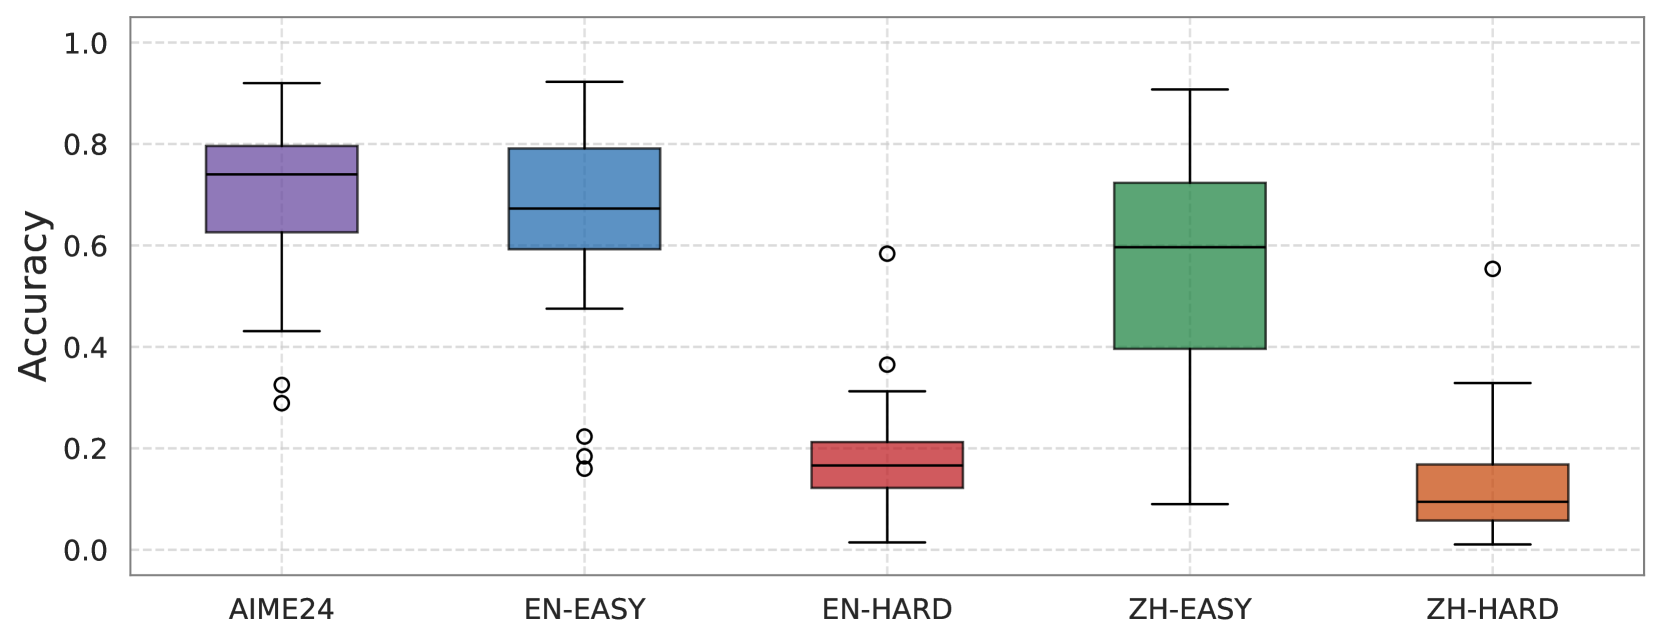
**Figure 1**: Box plots comparing accuracy distributions across five datasets: AIME24, EN-EASY, EN-HARD, ZH-EASY, and ZH-HARD. Accuracy values range from 0.0 to 1.0.
---
## Key Components and Spatial Grounding
1. **Axes**:
- **Y-Axis**: Labeled "Accuracy" with a linear scale from 0.0 to 1.0 (increments of 0.2).
- **X-Axis**: Categorical axis listing datasets: AIME24, EN-EASY, EN-HARD, ZH-EASY, ZH-HARD.
- **Grid**: Dashed gray grid lines for reference.
2. **Legend**:
- No explicit legend is present in the image. Colors are directly mapped to datasets as follows:
- **Purple**: AIME24
- **Blue**: EN-EASY
- **Red**: EN-HARD
- **Green**: ZH-EASY
- **Orange**: ZH-HARD
3. **Outliers**:
- Represented by black circles (○) outside the whiskers of each box plot.
---
## Dataset-Specific Analysis
### AIME24 (Purple)
- **Median Accuracy**: ~0.75 (horizontal line within the box).
- **Interquartile Range (IQR)**: ~0.65–0.80 (box height).
- **Outliers**: Two points at ~0.30 and ~0.35 (below the lower whisker).
### EN-EASY (Blue)
- **Median Accuracy**: ~0.65.
- **IQR**: ~0.55–0.70.
- **Outliers**: Two points at ~0.20 and ~0.25 (below the lower whisker).
### EN-HARD (Red)
- **Median Accuracy**: ~0.15.
- **IQR**: ~0.10–0.20.
- **Outliers**: One point at ~0.35 (above the upper whisker).
### ZH-EASY (Green)
- **Median Accuracy**: ~0.60.
- **IQR**: ~0.40–0.70.
- **Outliers**: One point at ~0.55 (above the upper whisker).
### ZH-HARD (Orange)
- **Median Accuracy**: ~0.10.
- **IQR**: ~0.05–0.15.
- **Outliers**: One point at ~0.30 (above the upper whisker).
---
## Key Trends and Observations
1. **Highest Accuracy**:
- **AIME24** demonstrates the highest median accuracy (~0.75) and the widest IQR (~0.65–0.80), indicating robust performance with moderate variability.
2. **Lowest Accuracy**:
- **EN-HARD** and **ZH-HARD** exhibit the lowest medians (~0.15 and ~0.10, respectively), with narrow IQRs, suggesting poor and consistent performance.
3. **Intermediate Performance**:
- **EN-EASY** and **ZH-EASY** show mid-range accuracy (~0.65 and ~0.60 medians). EN-EASY has a wider IQR (~0.55–0.70), indicating higher variability compared to ZH-EASY (~0.40–0.70).
4. **Outlier Patterns**:
- Outliers are sparse and concentrated below the lower whiskers for AIME24, EN-EASY, and ZH-HARD. EN-HARD and ZH-EASY have outliers above their upper whiskers.
---
## Data Table Reconstruction (Summary)
| Dataset | Median Accuracy | Lower Quartile | Upper Quartile | Outlier(s) |
|-----------|-----------------|----------------|----------------|---------------------|
| AIME24 | 0.75 | 0.65 | 0.80 | 0.30, 0.35 |
| EN-EASY | 0.65 | 0.55 | 0.70 | 0.20, 0.25 |
| EN-HARD | 0.15 | 0.10 | 0.20 | 0.35 |
| ZH-EASY | 0.60 | 0.40 | 0.70 | 0.55 |
| ZH-HARD | 0.10 | 0.05 | 0.15 | 0.30 |
---
## Color Consistency Verification
- All elements (box, median line, whiskers) for each dataset match the assigned color:
- AIME24: Purple (box, median, whiskers).
- EN-EASY: Blue (box, median, whiskers).
- EN-HARD: Red (box, median, whiskers).
- ZH-EASY: Green (box, median, whiskers).
- ZH-HARD: Orange (box, median, whiskers).
- Outliers (black circles) are consistent across all datasets.
---
## Conclusion
The box plots reveal significant disparities in accuracy across datasets. AIME24 and ZH-EASY outperform EN-HARD and ZH-HARD, while EN-EASY and ZH-EASY show moderate performance. Outliers suggest occasional deviations from typical accuracy ranges, particularly in harder datasets (EN-HARD, ZH-HARD).