## Chart: PCM and Synaptic Dynamics
### Overview
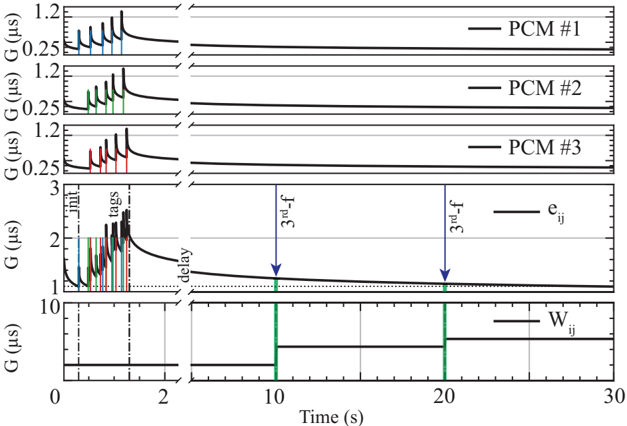
The image presents a series of time-series plots illustrating the dynamics of Phase Change Memory (PCM) cells and synaptic activity. The top three plots show the conductance (G) of three PCM cells (PCM #1, PCM #2, PCM #3) over time, with initial spiking behavior followed by a relatively stable state. The fourth plot shows the synaptic efficacy (e_ij) over time, exhibiting initial spiking behavior and then decaying to a lower value. The bottom plot shows the synaptic weight (W_ij) over time, with step changes at approximately 10s and 20s.
### Components/Axes
* **Y-axis (Conductance G):**
* Units: µs (microseconds)
* Range: Varies for each plot.
* PCM #1, #2, #3: 0.25 to 1.2
* e_ij: 1 to 3
* W_ij: 0 to 10
* **X-axis (Time):**
* Units: s (seconds)
* Range: 0 to 30
* **Legends (Top-Right):**
* PCM #1: Black line
* PCM #2: Black line
* PCM #3: Black line
* e_ij: Black line
* W_ij: Black line
* **Annotations:**
* "init": Vertical dashed line at approximately 0.2s
* "tags": Vertical dashed line at approximately 0.7s
* "delay": Text label pointing to the decaying part of the e_ij curve.
* "3rd-f": Downward arrows at approximately 10s and 20s on the e_ij plot.
### Detailed Analysis
* **PCM #1, PCM #2, PCM #3:**
* All three PCM cells exhibit similar behavior.
* Initial rapid spikes in conductance (G) within the first 2 seconds. The spikes are colored blue, green, and red respectively.
* After the initial spikes, the conductance stabilizes at a lower value, approximately 0.25 µs.
* Trend: Initial spikes followed by stabilization.
* **e_ij (Synaptic Efficacy):**
* Initial rapid spikes in synaptic efficacy (e_ij) within the first 2 seconds. The spikes are colored blue, green, and red respectively.
* After the initial spikes, the efficacy decays over time, starting from approximately 2.5 µs and decreasing to approximately 1 µs.
* Vertical arrows labeled "3rd-f" at approximately 10s and 20s.
* A horizontal dotted line is present at G = 1.
* Trend: Initial spikes, followed by decay.
* **W_ij (Synaptic Weight):**
* The synaptic weight (W_ij) starts at 0.
* At approximately 10s, W_ij jumps to a value of approximately 8.
* At approximately 20s, W_ij returns to 0.
* Trend: Step function with two transitions.
### Key Observations
* The PCM cells exhibit similar spiking behavior initially, followed by stabilization at a low conductance value.
* The synaptic efficacy (e_ij) shows initial spiking, followed by a decay over time.
* The synaptic weight (W_ij) exhibits step changes at specific time points, suggesting external control or events.
* The "3rd-f" annotations on the e_ij plot coincide with the step changes in W_ij.
### Interpretation
The data suggests a relationship between the PCM cell activity, synaptic efficacy, and synaptic weight. The initial spiking in the PCM cells and synaptic efficacy might represent an initial learning or adaptation phase. The subsequent decay in synaptic efficacy could represent forgetting or weakening of the synapse over time. The step changes in synaptic weight, triggered by external events ("3rd-f"), could represent reinforcement or modification of the synaptic connection. The "delay" annotation suggests a time delay in the effect of the initial spiking on the overall synaptic dynamics. The PCM cells are likely acting as input signals to a synapse, where the synaptic efficacy and weight determine the strength of the connection. The "3rd-f" events are likely external stimuli that modulate the synaptic weight.