## Multi-Panel Graph: Transient Response Analysis
### Overview
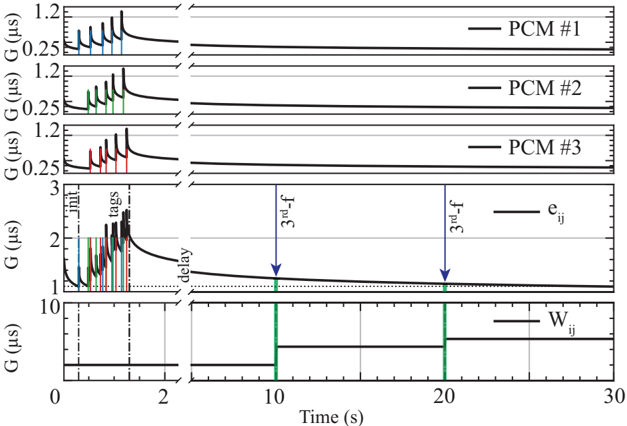
The image presents a multi-panel graph analyzing transient responses in a system. It includes three upper panels (PCM #1, PCM #2, PCM #3) showing decaying signals with colored spikes, a lower main graph with a decay curve and annotations, and an inset step function. The graph emphasizes time-dependent behavior, with axes labeled "Time (s)" and "G (μs)".
### Components/Axes
- **Axes**:
- **X-axis**: Time (s), ranging from 0 to 30 seconds.
- **Y-axis (Upper Panels)**: G (μs), scaled from 0.25 to 1.2.
- **Y-axis (Lower Main Graph)**: G (μs), scaled from 1 to 3.
- **Y-axis (Inset)**: Logarithmic scale from 1 to 10.
- **Legends**:
- **Upper Panels**: PCM #1 (black), PCM #2 (black), PCM #3 (black).
- **Lower Main Graph**: e_ij (black), W_ij (black).
- **Annotations**:
- Arrows labeled "3rd-f" (10s) and "e_ij" (20s) in the main graph.
- Dashed green line at 10s and 20s in the main graph.
- Inset labeled "W_ij" with a green step function.
### Detailed Analysis
- **Upper Panels (PCM #1–3)**:
- Each panel shows a decaying signal with transient spikes.
- **PCM #1**: Blue spikes at ~0.5s, 1.0s, 1.5s, 2.0s, 2.5s.
- **PCM #2**: Green spikes at ~0.5s, 1.0s, 1.5s, 2.0s, 2.5s.
- **PCM #3**: Red spikes at ~0.5s, 1.0s, 1.5s, 2.0s, 2.5s.
- All spikes decay to baseline within ~3s.
- **Lower Main Graph**:
- A smooth decay curve (black line) from ~3 μs to ~1 μs over 30s.
- **3rd-f** (blue arrow) at 10s, **e_ij** (blue arrow) at 20s.
- Dashed green line at 10s and 20s, aligning with the arrows.
- **Inset (W_ij)**:
- Step function with sharp transitions at 10s and 20s.
- Y-axis is logarithmic, showing a sudden increase at 10s and 20s.
### Key Observations
1. **Transient Spikes**: PCM panels exhibit rapid, synchronized spikes (blue, green, red) that decay within ~3s, suggesting short-lived events or perturbations.
2. **Decay Curve**: The main graph’s smooth decay indicates a prolonged system response, with the 3rd-f and e_ij points marking critical thresholds or events.
3. **Step Function**: The inset’s W_ij shows abrupt changes at 10s and 20s, possibly representing control inputs or system switches.
4. **Alignment**: The dashed green line in the main graph aligns with the 3rd-f and e_ij annotations, suggesting these points are tied to the step function’s transitions.
### Interpretation
- **System Behavior**: The PCM panels likely represent individual components (e.g., sensors or subsystems) showing transient responses, while the main graph reflects the system’s overall decay. The 3rd-f and e_ij annotations may indicate critical failure points or operational thresholds.
- **Step Function Role**: The W_ij inset’s step changes at 10s and 20s could modulate the system’s response, with the dashed line in the main graph highlighting these transitions.
- **Color Coding**: The distinct colors (blue, green, red) in the PCM panels may differentiate between measurement types or experimental conditions, though the legend does not explicitly clarify this.
- **Anomalies**: The smooth decay in the main graph contrasts with the sharp spikes in PCM panels, suggesting a hierarchical relationship between transient events and sustained system behavior.
This analysis underscores the interplay between transient phenomena (PCM spikes) and long-term system dynamics (decay curve), with the step function acting as a potential control mechanism.