\n
## Diagram: Lambda Calculus Reduction Diagrams
### Overview
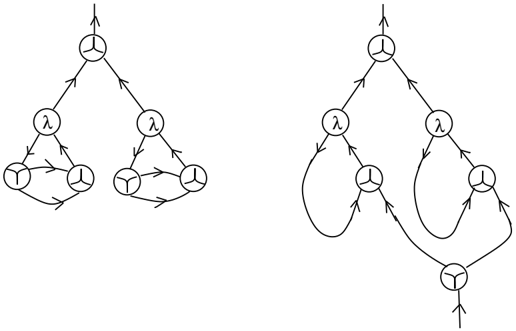
The image presents two diagrams illustrating the reduction process in lambda calculus. Both diagrams depict a series of nodes connected by directed edges, representing the application of lambda reduction rules. The diagrams show how a complex expression is simplified through successive substitutions.
### Components/Axes
The diagrams consist of the following components:
* **Nodes:** Represented by circles. Some nodes are labeled with the Greek letter "λ" (lambda), indicating a lambda abstraction. Other nodes are unlabeled, representing variables or application results.
* **Directed Edges:** Arrows indicating the direction of reduction or substitution.
* **Arrows pointing upwards:** Indicate the start and end points of the reduction process.
### Detailed Analysis or Content Details
**Diagram 1 (Left):**
* The diagram starts with a single node at the top, with an upward-pointing arrow.
* This node branches into two identical sub-diagrams.
* Each sub-diagram contains a node labeled "λ" at the center.
* The "λ" node connects to two unlabeled nodes at the bottom, forming a triangle.
* Each of the bottom nodes has a self-loop (an arrow pointing back to itself) and an arrow connecting it to the other bottom node.
* The "λ" node also has an arrow pointing upwards to the top node.
**Diagram 2 (Right):**
* The diagram starts with a single node at the top, with an upward-pointing arrow.
* This node branches into two nodes labeled "λ".
* Each "λ" node connects to an unlabeled node.
* Each unlabeled node has a self-loop and an arrow connecting it back to the "λ" node it originated from.
* The bottom two unlabeled nodes are connected by an arrow, forming a loop.
* The bottom node also has an upward-pointing arrow.
### Key Observations
* Both diagrams represent a reduction process, but the structure of the reduction differs.
* Diagram 1 shows a parallel reduction of two identical expressions.
* Diagram 2 shows a sequential reduction, with the result of one reduction feeding into the next.
* The self-loops in both diagrams indicate repeated application of a reduction rule.
* The diagrams are purely structural and do not contain numerical data.
### Interpretation
The diagrams illustrate different strategies for evaluating lambda expressions. Diagram 1 represents a parallel reduction strategy, where both branches of the expression are reduced simultaneously. Diagram 2 represents a sequential reduction strategy, where one branch is reduced before the other. The choice of reduction strategy can affect the efficiency and termination of the evaluation process. The diagrams are abstract representations of the reduction process and do not specify the exact lambda expression being reduced. They are intended to convey the general structure of the reduction process rather than the specific details of a particular expression. The diagrams are useful for understanding the concepts of lambda calculus and the different ways in which lambda expressions can be evaluated. The diagrams are not providing facts or data, but rather a visual representation of a process.