## Flowchart Diagram: System Process Flow Comparison
### Overview
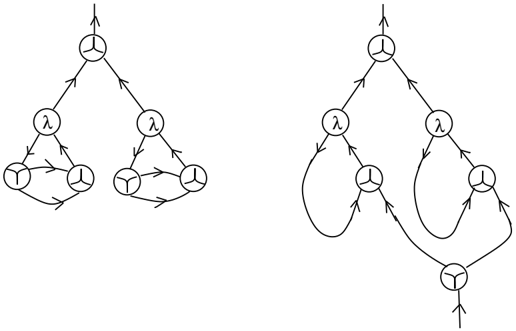
The image contains two side-by-side diagrams depicting node-based systems with directional flows. Both diagrams use circular nodes labeled with Greek letters (λ) and Latin letters (Y), connected by arrows indicating directional relationships. The left diagram shows a hierarchical structure, while the right introduces feedback loops.
### Components/Axes
- **Nodes**:
- Top node: Labeled "λ" (Greek lambda).
- Middle layer: Two nodes labeled "λ".
- Bottom layer: Four nodes labeled "Y" (Latin Y).
- **Arrows**:
- **Left Diagram**:
- Bidirectional arrows between the top "λ" and middle "λ" nodes.
- Unidirectional arrows from middle "λ" nodes to bottom "Y" nodes.
- Bidirectional arrows between the four bottom "Y" nodes.
- **Right Diagram**:
- Bidirectional arrows between the top "λ" and middle "λ" nodes.
- Unidirectional arrows from middle "λ" nodes to bottom "Y" nodes.
- Feedback loops from bottom "Y" nodes back to middle "λ" nodes.
- A final unidirectional arrow from the bottom-right "Y" node to a terminal node.
### Detailed Analysis
- **Left Diagram**:
- The top "λ" node distributes flow equally to two middle "λ" nodes via bidirectional arrows, suggesting mutual interaction or shared responsibility.
- Each middle "λ" node feeds into two bottom "Y" nodes via unidirectional arrows, indicating a one-way progression.
- The bottom "Y" nodes form a fully connected network via bidirectional arrows, implying reciprocal interactions or data exchange.
- **Right Diagram**:
- Similar hierarchical structure to the left diagram, but with added feedback loops from the bottom "Y" nodes to the middle "λ" nodes.
- The feedback loops suggest iterative processes or error correction mechanisms.
- A terminal node at the bottom-right "Y" node indicates a final output or endpoint.
### Key Observations
1. **Bidirectional vs. Unidirectional Flow**:
- The left diagram emphasizes mutual interactions at the bottom layer, while the right diagram introduces feedback to refine or adjust upstream processes.
2. **Terminal Node**:
- The right diagram’s terminal node implies a definitive endpoint, absent in the left diagram.
3. **Symmetry**:
- Both diagrams maintain symmetry in node distribution (1 top, 2 middle, 4 bottom nodes).
### Interpretation
- **System Behavior**:
- The left diagram likely represents a static, hierarchical system where processes flow downward without iteration.
- The right diagram models a dynamic system with feedback loops, enabling adaptation or correction based on downstream outputs.
- **Potential Applications**:
- The left diagram could represent a decision tree or linear workflow.
- The right diagram might model a control system, error-handling mechanism, or iterative algorithm (e.g., machine learning training loops).
- **Anomalies**:
- The terminal node in the right diagram breaks the symmetry of the left, suggesting a designed endpoint for specific outputs.
## Language Note
No non-English text is present. All labels use standard mathematical notation (Greek lambda, Latin Y).