## Bar Chart: Latency Comparison Between FP16 and INT8 Across Batch Sizes
### Overview
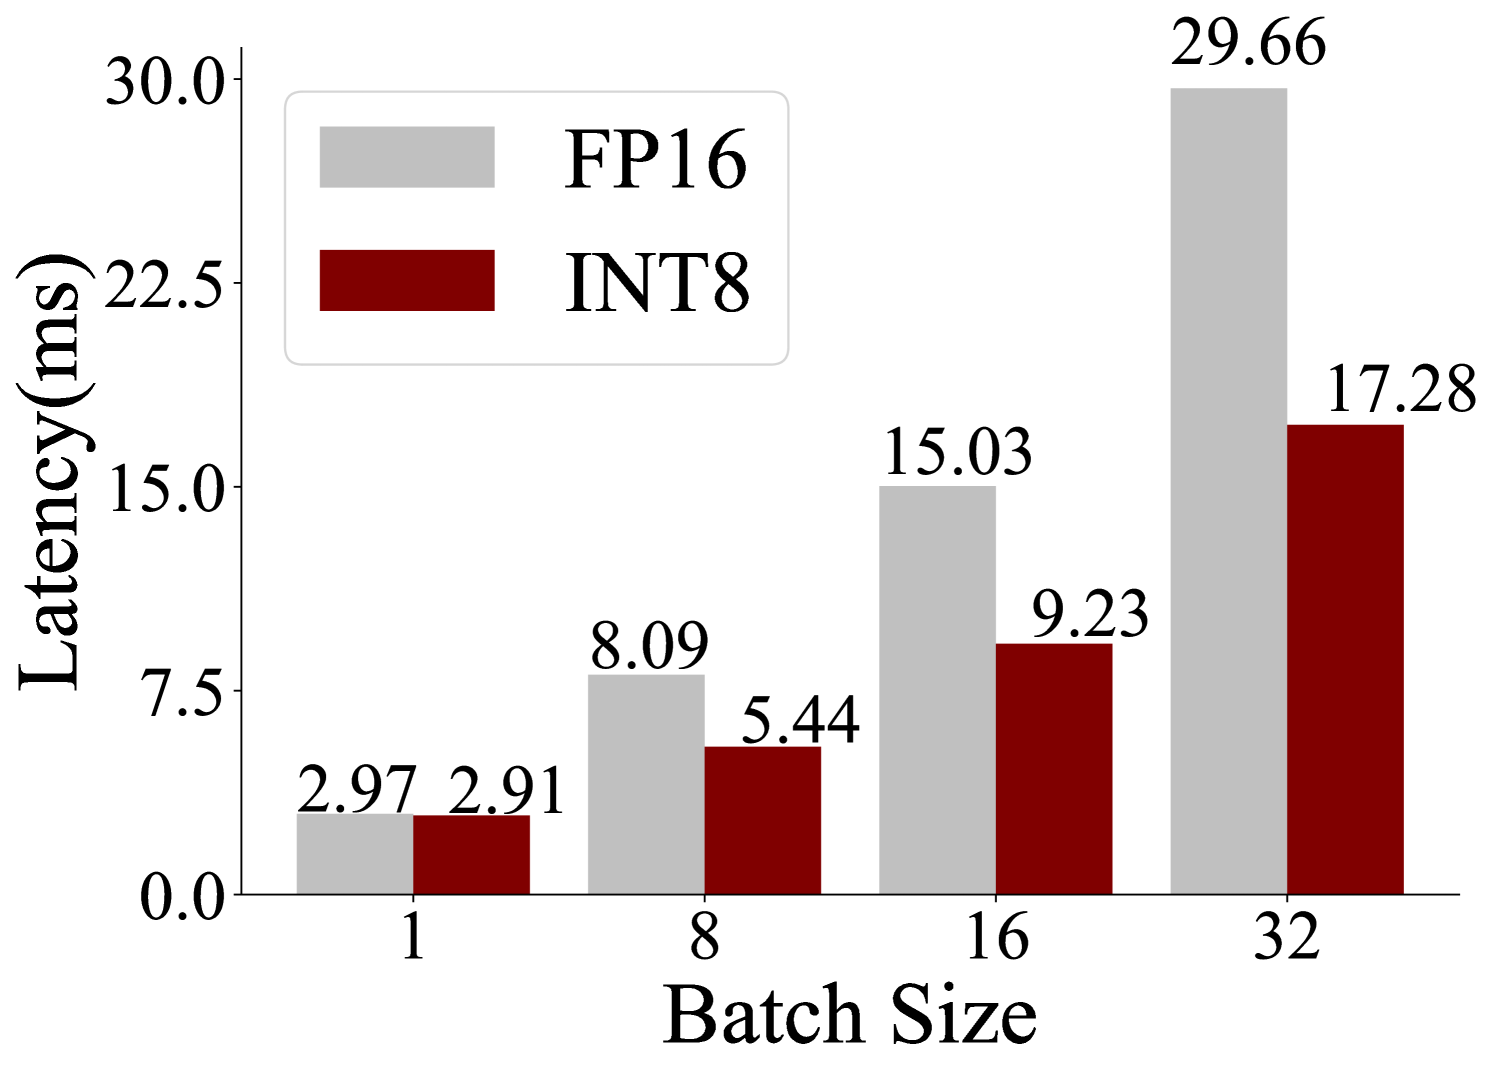
The chart compares latency (in milliseconds) for two computational methods, **FP16** (gray bars) and **INT8** (red bars), across four batch sizes: 1, 8, 16, and 32. Latency increases with batch size for both methods, but FP16 consistently exhibits higher latency than INT8.
### Components/Axes
- **X-axis (Batch Size)**: Labeled "Batch Size" with discrete categories: 1, 8, 16, 32.
- **Y-axis (Latency)**: Labeled "Latency (ms)" with a scale from 0.0 to 30.0 in increments of 7.5.
- **Legend**: Located in the top-left corner, associating gray with FP16 and red with INT8.
- **Bars**: Paired bars for each batch size, with numerical values labeled on top of each bar.
### Detailed Analysis
- **Batch Size 1**:
- FP16: 2.97 ms (gray bar).
- INT8: 2.91 ms (red bar).
- **Batch Size 8**:
- FP16: 8.09 ms (gray bar).
- INT8: 5.44 ms (red bar).
- **Batch Size 16**:
- FP16: 15.03 ms (gray bar).
- INT8: 9.23 ms (red bar).
- **Batch Size 32**:
- FP16: 29.66 ms (gray bar).
- INT8: 17.28 ms (red bar).
### Key Observations
1. **FP16 vs. INT8**: FP16 latency is consistently higher than INT8 across all batch sizes (e.g., 29.66 ms vs. 17.28 ms at batch size 32).
2. **Scaling Trends**:
- FP16 latency increases non-linearly with batch size (e.g., 2.97 → 29.66 ms as batch size grows from 1 to 32).
- INT8 latency increases linearly (e.g., 2.91 → 17.28 ms over the same range).
3. **Gap Widening**: The performance gap between FP16 and INT8 widens as batch size increases (e.g., 0.06 ms difference at batch size 1 vs. 12.38 ms at batch size 32).
### Interpretation
- **Technical Implications**: FP16’s higher latency suggests it is less efficient for large-scale computations, likely due to the overhead of floating-point operations. INT8’s lower latency indicates better optimization for integer-based processing, which is common in machine learning inference.
- **Batch Size Sensitivity**: The non-linear scaling of FP16 latency highlights its inefficiency for large batches, making INT8 a preferable choice for high-throughput applications.
- **Outliers**: No anomalies detected; trends align with expectations for computational method performance.