## Bar Chart: Latency vs. Batch Size for FP16 and INT8
### Overview
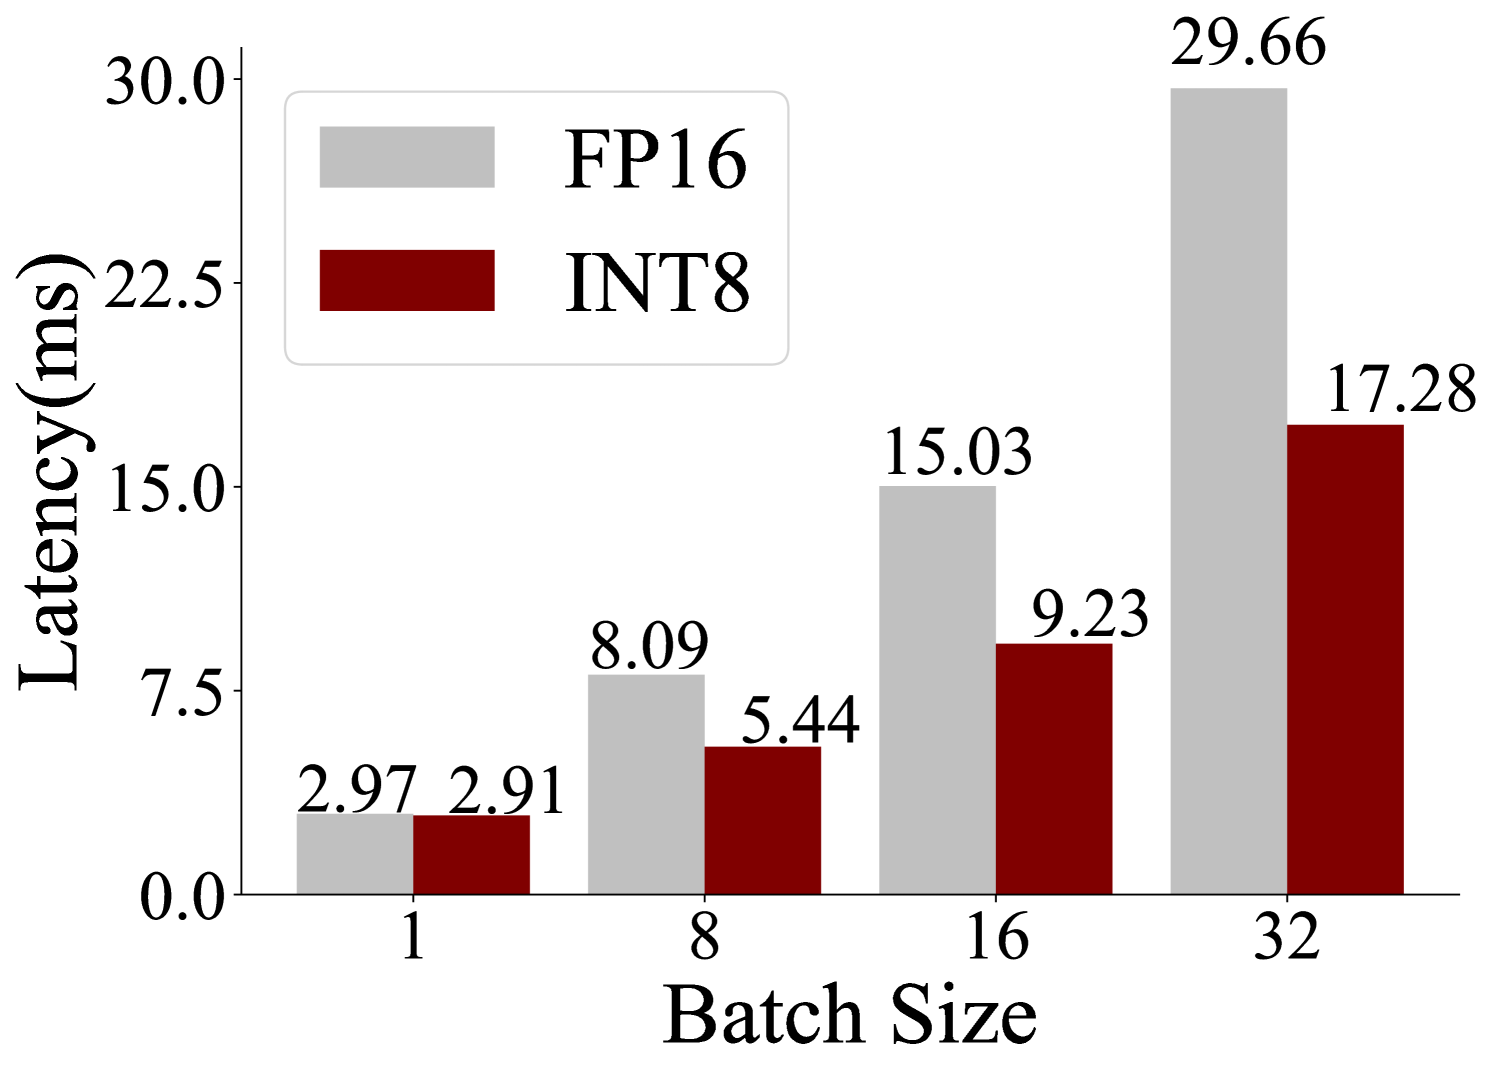
The image is a bar chart comparing the latency (in milliseconds) of FP16 and INT8 data types for different batch sizes (1, 8, 16, and 32). The chart shows how latency increases with batch size for both data types, but INT8 generally has lower latency than FP16 for the same batch size.
### Components/Axes
* **X-axis:** Batch Size, with values 1, 8, 16, and 32.
* **Y-axis:** Latency (ms), ranging from 0.0 to 30.0, with tick marks at 0.0, 7.5, 15.0, 22.5, and 30.0.
* **Legend:** Located in the top-left corner.
* Gray bar: FP16
* Dark Red bar: INT8
### Detailed Analysis
Here's a breakdown of the latency values for each batch size and data type:
* **Batch Size 1:**
* FP16 (Gray): 2.97 ms
* INT8 (Dark Red): 2.91 ms
* **Batch Size 8:**
* FP16 (Gray): 8.09 ms
* INT8 (Dark Red): 5.44 ms
* **Batch Size 16:**
* FP16 (Gray): 15.03 ms
* INT8 (Dark Red): 9.23 ms
* **Batch Size 32:**
* FP16 (Gray): 29.66 ms
* INT8 (Dark Red): 17.28 ms
**Trend Verification:**
Both FP16 and INT8 latencies increase as the batch size increases.
### Key Observations
* For all batch sizes, INT8 has lower latency than FP16.
* The difference in latency between FP16 and INT8 becomes more pronounced as the batch size increases.
* The latency increases approximately linearly with batch size for both data types, but the slope is steeper for FP16.
### Interpretation
The chart demonstrates that using INT8 data type results in lower latency compared to FP16 for the given task, and this advantage becomes more significant as the batch size increases. This suggests that INT8 is more efficient for larger batch sizes in this particular scenario. The near-linear increase in latency with batch size indicates a consistent processing overhead for each additional element in the batch. The steeper slope for FP16 suggests that it is more sensitive to increases in batch size than INT8.