\n
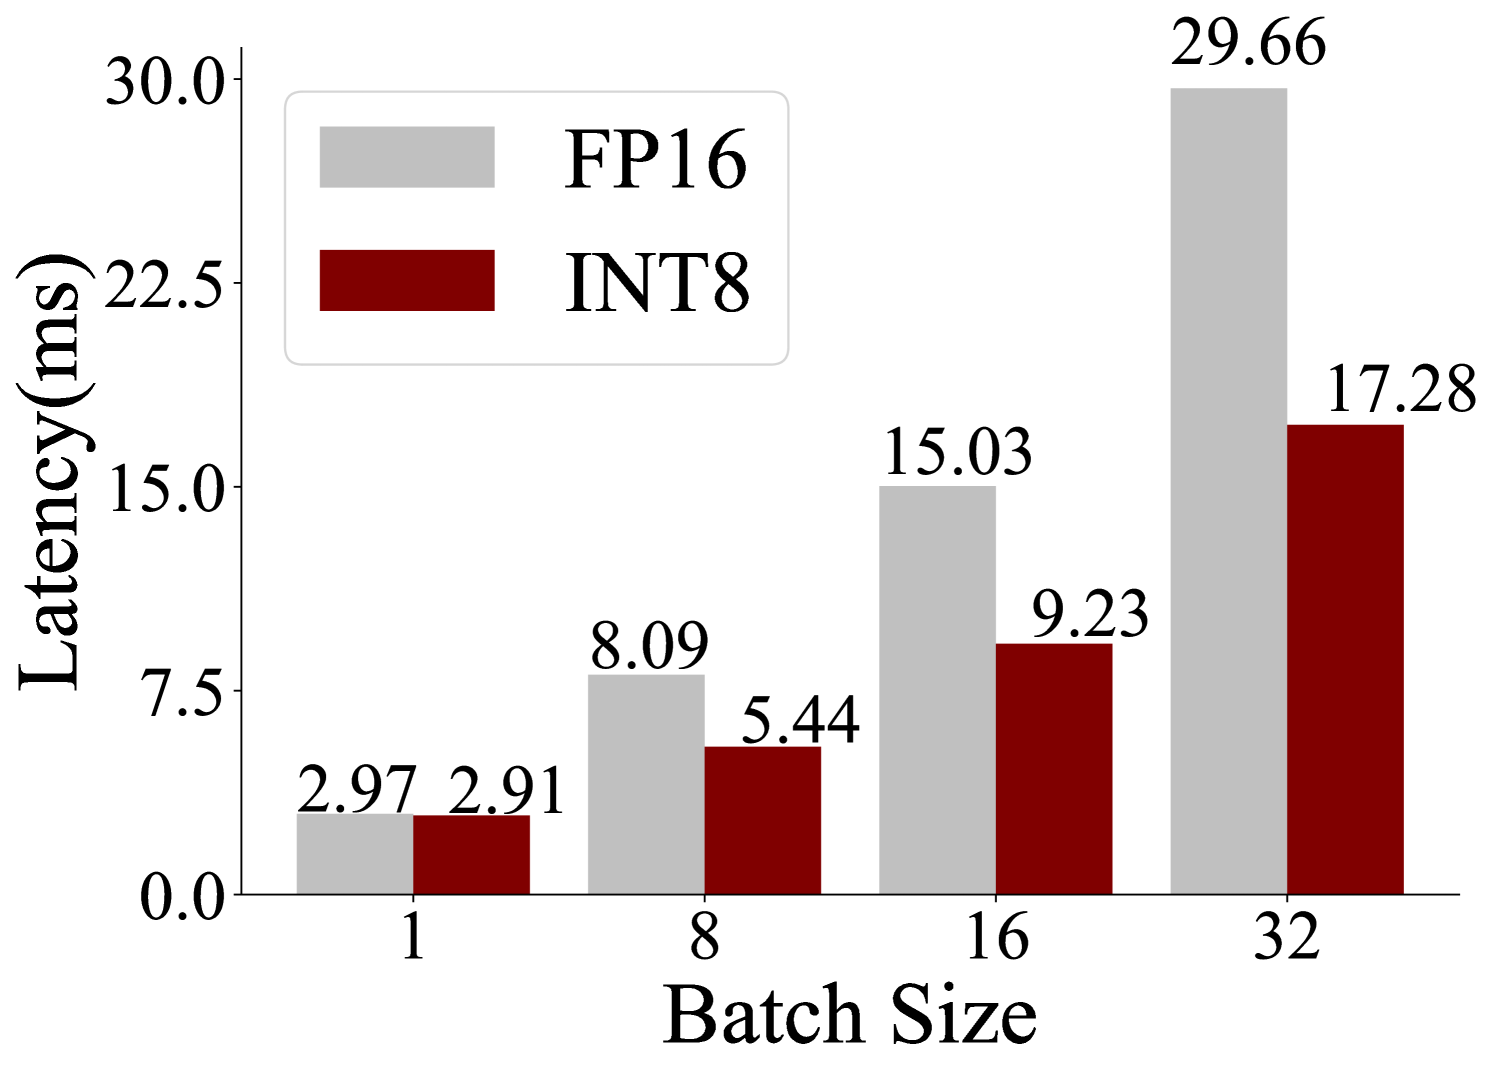
## Bar Chart: Latency vs. Batch Size for FP16 and INT8
### Overview
This bar chart compares the latency (in milliseconds) of two data types, FP16 and INT8, across different batch sizes (1, 8, 16, and 32). The chart uses a bar graph format to visually represent the latency for each combination of data type and batch size.
### Components/Axes
* **X-axis:** Batch Size (with markers 1, 8, 16, 32)
* **Y-axis:** Latency (ms) - Scale ranges from 0.0 to 30.0, with increments of 5.0.
* **Legend:** Located in the top-left corner.
* FP16: Represented by light gray bars.
* INT8: Represented by dark red bars.
### Detailed Analysis
The chart presents latency values for each batch size and data type.
* **Batch Size 1:**
* FP16: Approximately 2.97 ms.
* INT8: Approximately 2.91 ms.
* **Batch Size 8:**
* FP16: Approximately 8.09 ms.
* INT8: Approximately 5.44 ms.
* **Batch Size 16:**
* FP16: Approximately 15.03 ms.
* INT8: Approximately 9.23 ms.
* **Batch Size 32:**
* FP16: Approximately 29.66 ms.
* INT8: Approximately 17.28 ms.
**Trends:**
* **FP16:** The latency increases consistently as the batch size increases. The increase appears roughly linear.
* **INT8:** The latency also increases with batch size, but the rate of increase appears slightly less steep than FP16.
### Key Observations
* INT8 consistently exhibits lower latency than FP16 across all batch sizes.
* The difference in latency between FP16 and INT8 becomes more pronounced as the batch size increases. At a batch size of 1, the difference is minimal (approximately 0.06 ms), but at a batch size of 32, the difference is significant (approximately 12.38 ms).
* The latency values for both data types increase substantially as the batch size grows.
### Interpretation
The data suggests that using INT8 quantization can significantly reduce latency compared to FP16, especially when processing larger batches of data. This is likely due to the reduced memory footprint and computational requirements of INT8. The consistent increase in latency with batch size for both data types is expected, as larger batches require more processing time. The widening gap between FP16 and INT8 latency as batch size increases indicates that the benefits of INT8 become more substantial with larger workloads. This information is valuable for optimizing performance in machine learning inference, where latency is a critical factor. The chart demonstrates a clear trade-off between precision (FP16) and speed (INT8).