## Bar Chart: Latency vs. Batch Size for FP16 and INT8 Precision
### Overview
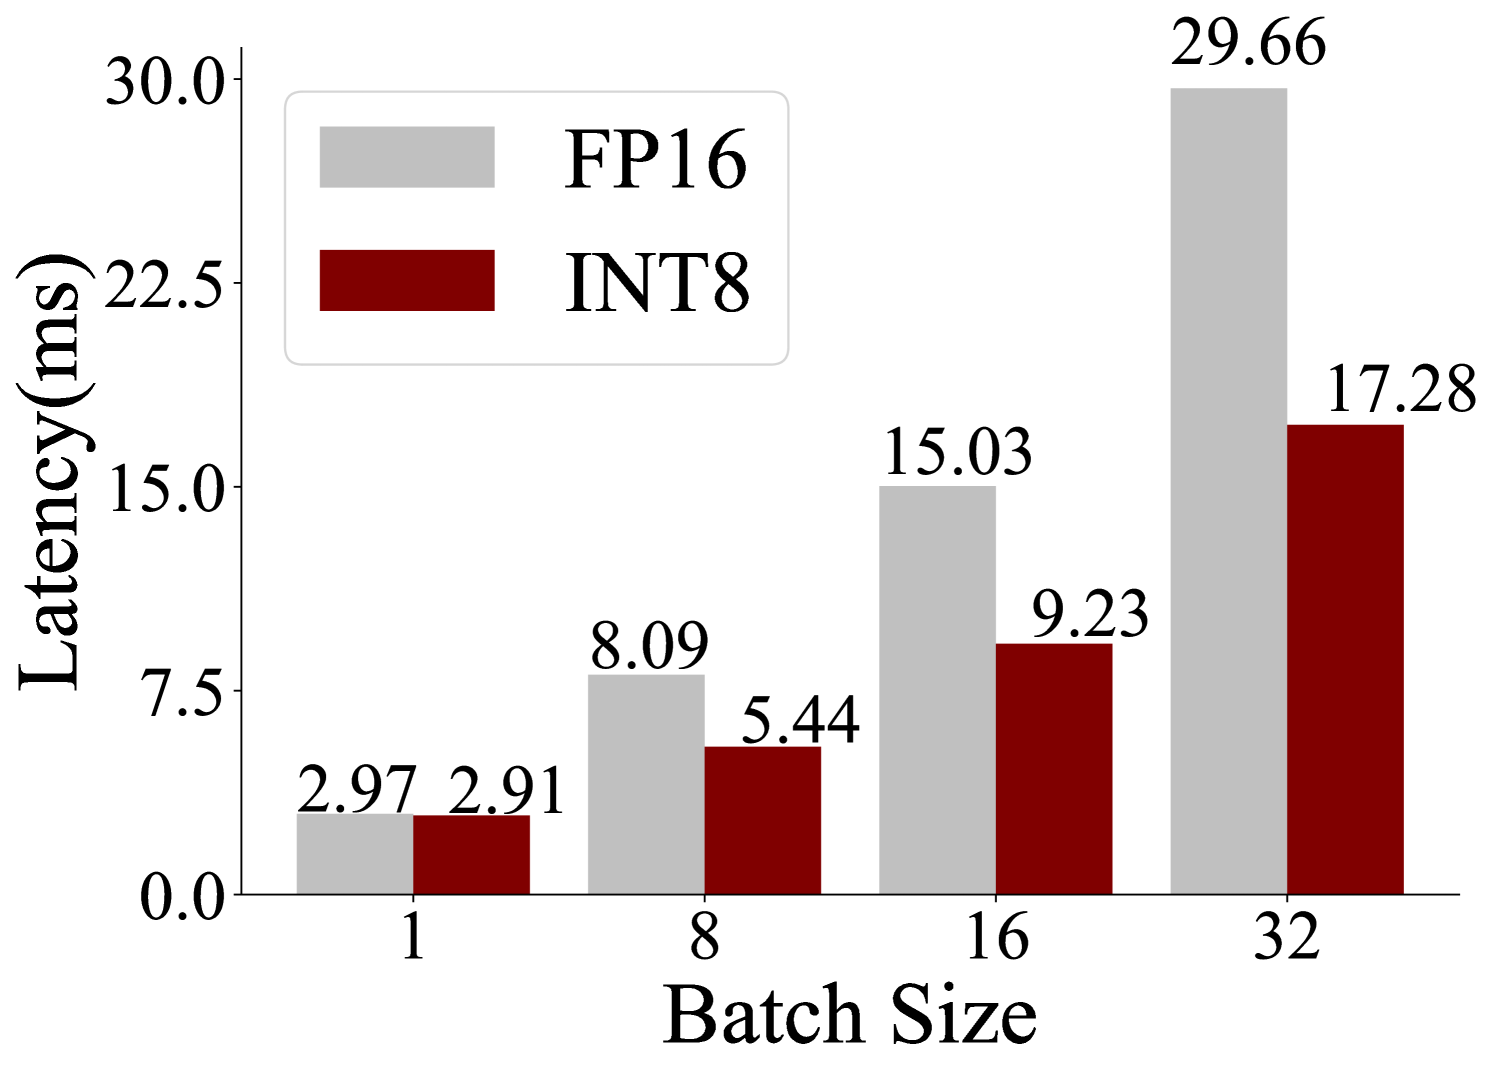
The image is a grouped bar chart comparing the inference latency (in milliseconds) of two numerical precision formats, FP16 (16-bit floating point) and INT8 (8-bit integer), across four different batch sizes. The chart visually demonstrates the performance advantage of INT8 quantization over FP16, particularly as the workload (batch size) increases.
### Components/Axes
* **Chart Type:** Grouped vertical bar chart.
* **X-Axis:** Labeled **"Batch Size"**. It has four discrete categories: **1, 8, 16, and 32**.
* **Y-Axis:** Labeled **"Latency(ms)"**. The scale is linear, ranging from **0.0 to 30.0** with major tick marks at intervals of 7.5 (0.0, 7.5, 15.0, 22.5, 30.0).
* **Legend:** Positioned in the **top-left corner** of the chart area. It contains two entries:
* A light gray rectangle labeled **"FP16"**.
* A dark red (maroon) rectangle labeled **"INT8"**.
* **Data Series:** Two series of bars, grouped by batch size.
* **FP16 Series:** Light gray bars.
* **INT8 Series:** Dark red bars.
### Detailed Analysis
The exact latency values are annotated above each bar.
**Batch Size = 1:**
* FP16 (light gray bar): **2.97 ms**
* INT8 (dark red bar): **2.91 ms**
* *Trend Check:* Both bars are very short and nearly equal in height, indicating minimal latency difference at the smallest batch size.
**Batch Size = 8:**
* FP16 (light gray bar): **8.09 ms**
* INT8 (dark red bar): **5.44 ms**
* *Trend Check:* Both bars are taller than at batch size 1. The FP16 bar is now noticeably taller than the INT8 bar.
**Batch Size = 16:**
* FP16 (light gray bar): **15.03 ms**
* INT8 (dark red bar): **9.23 ms**
* *Trend Check:* Latency continues to increase for both. The height difference between the FP16 and INT8 bars has grown larger.
**Batch Size = 32:**
* FP16 (light gray bar): **29.66 ms**
* INT8 (dark red bar): **17.28 ms**
* *Trend Check:* This is the tallest pair of bars. The FP16 bar is significantly taller than the INT8 bar, showing the largest absolute difference in latency.
### Key Observations
1. **Consistent Performance Advantage:** For every batch size tested, the INT8 (dark red) bar is shorter than the corresponding FP16 (light gray) bar, indicating lower latency.
2. **Diverging Trend:** The performance gap between FP16 and INT8 widens as the batch size increases. At batch size 1, the difference is negligible (0.06 ms). At batch size 32, the difference is substantial (12.38 ms).
3. **Scaling Behavior:** Latency for both precision formats increases with batch size. However, the rate of increase (slope) is steeper for FP16 than for INT8.
4. **Data Integrity:** All values are explicitly labeled, removing ambiguity in reading the bar heights against the y-axis scale.
### Interpretation
This chart provides clear empirical evidence for the inference performance benefits of using INT8 quantization over FP16 precision in a computational workload (likely a neural network inference task).
* **What the data suggests:** INT8 quantization reduces computational latency. This benefit becomes more pronounced under heavier loads (larger batch sizes), suggesting that INT8 operations scale more efficiently. The near-equal latency at batch size 1 indicates that the overhead of quantization/dequantization or other fixed costs may be minimal compared to the compute savings.
* **How elements relate:** The x-axis (Batch Size) represents the independent variable—the workload intensity. The y-axis (Latency) is the dependent variable—the performance cost. The two bar colors (FP16 vs. INT8) represent the independent variable being tested—the precision format. The chart's structure directly compares the dependent variable across the two conditions for each level of workload.
* **Notable implications:** For system designers and ML engineers, this data argues for adopting INT8 quantization to improve throughput and reduce response times in production inference systems, especially for services that process requests in batches. The significant saving at batch size 32 (a ~42% reduction in latency) could translate to major cost savings or increased capacity in a deployed service. The chart effectively communicates that the performance advantage of INT8 is not static but scales favorably with demand.