## Neural Network Analysis and Performance
### Overview
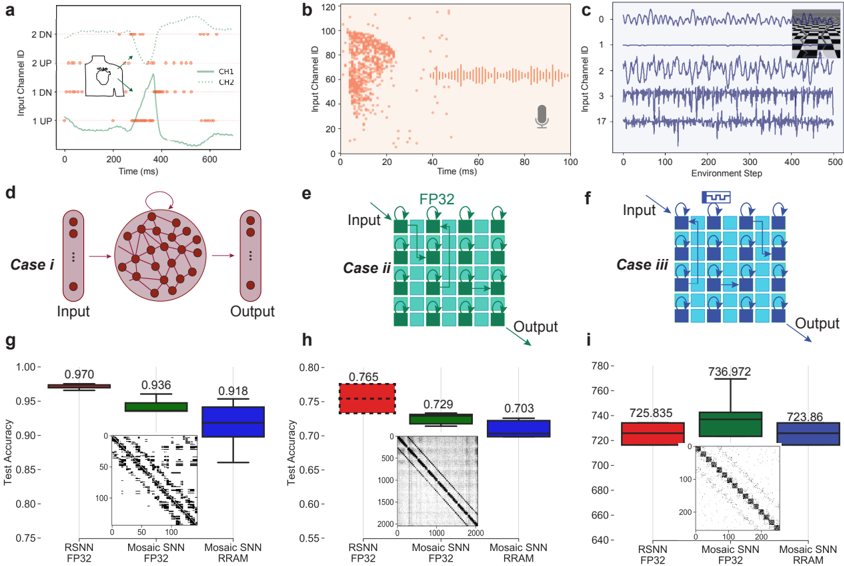
The image presents a comparative analysis of different neural network architectures, including RSNN FP32, Mosaic SNN FP32, and Mosaic SNN RRAM. It includes visualizations of input data, network diagrams, and performance metrics in terms of test accuracy.
### Components/Axes
**Panel a:**
* **Type:** Time-series plot with overlaid scatter plot.
* **X-axis:** Time (ms), ranging from 0 to 600 ms.
* **Y-axis:** Input Channel ID, labeled as "1 UP", "1 DN", "2 UP", "2 DN".
* **Data Series:**
* CH1 (solid green line): Represents the input channel 1.
* CH2 (dotted light green line): Represents the input channel 2.
* Red dots overlaid on both lines, indicating discrete events.
* **Inset:** A small diagram of a body with an arrow pointing to the "EAR".
**Panel b:**
* **Type:** Scatter plot and time-series plot.
* **X-axis:** Time (ms), ranging from 0 to 100 ms.
* **Y-axis:** Input Channel ID, ranging from 0 to 120.
* **Data:** Orange dots scattered across the plot, concentrated between 0-20 ms.
* **Audio Waveform:** A time-series plot of an audio waveform is shown on the right side of the scatter plot.
* **Icon:** A microphone icon is present on the right side.
**Panel c:**
* **Type:** Time-series plot.
* **X-axis:** Environment Step, ranging from 0 to 500.
* **Y-axis:** Input Channel ID, labeled as 0, 1, 2, 3, and 17.
* **Data Series:** Multiple blue lines representing different input channels.
* **Inset:** A small image of a checkerboard pattern.
**Panel d:**
* **Type:** Diagram of a recurrent neural network.
* **Description:** Shows a network with an input layer, a recurrent layer (circular with interconnected nodes), and an output layer.
* **Labels:** "Case i", "Input", "Output".
**Panel e:**
* **Type:** Diagram of a mosaic neural network.
* **Description:** Shows a grid-like structure with interconnected blocks. Arrows indicate the flow of information.
* **Labels:** "Case ii", "Input", "Output", "FP32".
**Panel f:**
* **Type:** Diagram of a mosaic neural network.
* **Description:** Similar to panel e, but with a different color scheme and connection pattern.
* **Labels:** "Case iii", "Input", "Output", "Input".
**Panel g:**
* **Type:** Box plot comparing test accuracy.
* **Y-axis:** Test Accuracy, ranging from 0.75 to 1.00.
* **X-axis:** Categories: RSNN FP32, Mosaic SNN FP32, Mosaic SNN RRAM.
* **Values:**
* RSNN FP32: Approximately 0.970
* Mosaic SNN FP32: Approximately 0.936
* Mosaic SNN RRAM: Approximately 0.918
* **Inset:** A matrix visualization.
**Panel h:**
* **Type:** Box plot comparing test accuracy.
* **Y-axis:** Test Accuracy, ranging from 0.55 to 0.80.
* **X-axis:** Categories: RSNN FP32, Mosaic SNN FP32, Mosaic SNN RRAM.
* **Values:**
* RSNN FP32: Approximately 0.765
* Mosaic SNN FP32: Approximately 0.729
* Mosaic SNN RRAM: Approximately 0.703
* **Inset:** A matrix visualization.
**Panel i:**
* **Type:** Box plot comparing test accuracy.
* **Y-axis:** Test Accuracy, ranging from 640 to 780.
* **X-axis:** Categories: RSNN FP32, Mosaic SNN FP32, Mosaic SNN RRAM.
* **Values:**
* RSNN FP32: Approximately 725.835
* Mosaic SNN FP32: Approximately 736.972
* Mosaic SNN RRAM: Approximately 723.86
* **Inset:** A matrix visualization.
### Detailed Analysis or ### Content Details
**Panel a:** The green line (CH1) shows a clear upward trend between 300ms and 400ms, corresponding to the "1 UP" level. The dotted light green line (CH2) remains relatively stable at the "2 DN" level.
**Panel b:** The scatter plot shows a high density of events between 0 and 20 ms. The audio waveform appears to be periodic.
**Panel c:** The time-series plot shows varying levels of activity across different input channels. Channels 2 and 17 exhibit more dynamic behavior.
**Panels d, e, f:** These diagrams illustrate different neural network architectures. Panel d shows a standard recurrent neural network. Panels e and f show mosaic-like architectures with different connection patterns.
**Panels g, h, i:** These box plots compare the test accuracy of the different network architectures. In panel g, RSNN FP32 has the highest accuracy. In panel h, RSNN FP32 also has the highest accuracy. In panel i, Mosaic SNN FP32 has the highest accuracy.
### Key Observations
* RSNN FP32 generally performs well in the tasks represented in panels g and h.
* Mosaic SNN FP32 performs best in the task represented in panel i.
* The matrix visualizations in panels g, h, and i show different patterns, suggesting different internal representations learned by the networks.
### Interpretation
The image presents a comparative study of different neural network architectures and their performance on various tasks. The results suggest that the choice of architecture can significantly impact performance, and the optimal architecture may depend on the specific task. The visualizations of input data and network diagrams provide insights into the internal workings of these networks. The matrix visualizations likely represent the weight matrices or connectivity patterns within the networks, offering a glimpse into how the networks learn and represent information.