## Multi-Panel Technical Visualization Analysis
### Overview
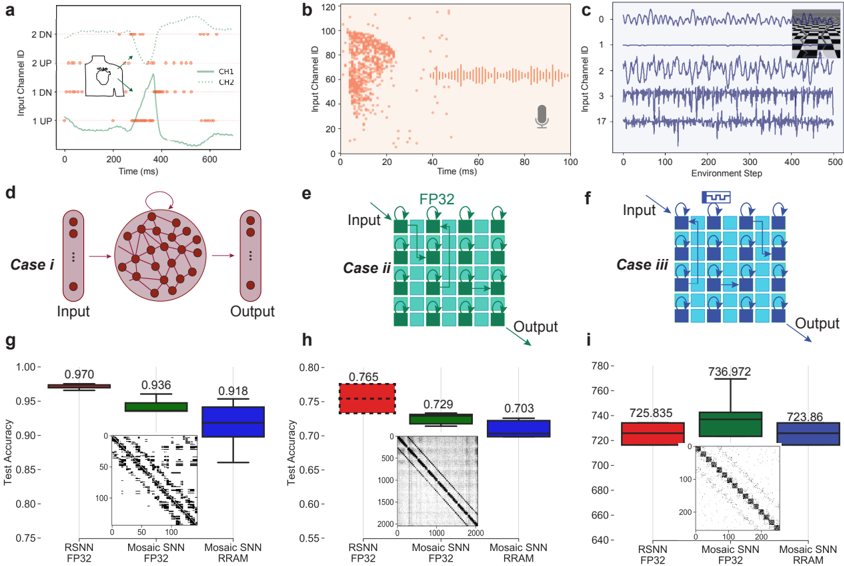
The image contains nine panels (a-i) presenting neural network performance data, architectural diagrams, and comparative metrics. Panels a-c show time-series data, d-f illustrate network architectures, and g-i present comparative box plots. All elements use consistent color coding (green, orange, blue) with explicit legends.
### Components/Axes
**Panel a (Line Chart):**
- Y-axis: Input Channel ID (1 UP, 1 DN, 2 UP, 2 DN)
- X-axis: Time (ms)
- Legend: CH1 (green), CH2 (orange)
- Spatial: Legend positioned right of plot
**Panel b (Scatter Plot):**
- Y-axis: Input Channel ID (0-120)
- X-axis: Time (ms)
- Elements: Orange scatter points + waveform annotation
- Spatial: Microphone icon at bottom center
**Panel c (Line Chart):**
- Y-axis: Input Channel ID (1-17)
- X-axis: Environment Step (0-500)
- Legend: Four distinct line patterns
- Spatial: Legend positioned right of plot
**Panel d (Neural Network Diagram):**
- Components: Input layer (left), Hidden layer (Case i), Output layer (right)
- Connections: Red dots with bidirectional arrows
- Spatial: Circular hidden layer at center
**Panel e (Grid Diagram):**
- Structure: 3x3 grid with FP32 labels
- Flow: Input → Hidden → Output arrows
- Color: Teal grid with green nodes
**Panel f (Grid Diagram):**
- Structure: 3x3 grid with FP32 labels
- Flow: Input → Hidden → Output arrows
- Color: Cyan grid with blue nodes
**Panel g (Box Plot):**
- Categories: RSNN FP32, Mosaic SNN FP32, Mosaic SNN RRAM
- Y-axis: Test Accuracy (0.75-1.00)
- Values: 0.970, 0.936, 0.918
**Panel h (Box Plot):**
- Categories: RSNN FP32, Mosaic SNN FP32, Mosaic SNN RRAM
- Y-axis: Test Accuracy (0.55-0.80)
- Values: 0.765, 0.729, 0.703
**Panel i (Box Plot):**
- Categories: RSNN FP32, Mosaic SNN FP32, Mosaic SNN RRAM
- Y-axis: Test Accuracy (640-780)
- Values: 725.835, 736.972, 723.86
### Detailed Analysis
**Panel a:** CH1 (green) shows a prominent peak at ~300ms (2.5 DN), while CH2 (orange) maintains stable oscillations. Both lines exhibit periodic patterns with CH1 having higher amplitude variations.
**Panel b:** Orange scatter points cluster densely at lower Input Channel IDs (<40) before 20ms, then disperse along a diagonal line suggesting temporal correlation. The waveform annotation implies audio signal processing.
**Panel c:** Four lines demonstrate varying stability - Line 1 (solid) shows consistent oscillations, Line 2 (dashed) has increasing amplitude, Line 3 (dotted) exhibits irregular spikes, and Line 4 (dash-dot) maintains moderate stability.
**Panel d:** Case i architecture shows dense bidirectional connections between input (3 nodes) and output (3 nodes) through a hidden layer (12 nodes). Red color coding emphasizes neural connectivity.
**Panel e:** Case ii uses a 3x3 grid with explicit FP32 precision labels. Green nodes indicate processing units with directional data flow arrows.
**Panel f:** Case iii employs a similar grid structure but with blue nodes and modified connection patterns, suggesting architectural variations.
**Panel g:** RSNN FP32 achieves highest accuracy (0.970) with tight interquartile range. Mosaic SNN RRAM shows lowest performance (0.918) with wider distribution.
**Panel h:** All models show reduced accuracy vs panel g, with Mosaic SNN RRAM at 0.703 (bottom quartile). RSNN FP32 maintains lead at 0.765.
**Panel i:** Numerical values suggest metric shift (possibly latency or resource usage). Mosaic SNN FP32 peaks at 736.972, while RSNN FP32 shows 725.835.
### Key Observations
1. **Temporal Patterns:** CH1 exhibits distinct spike activity at 300ms (panel a), while panel c shows environment-dependent channel behavior.
2. **Accuracy Gradient:** RSNN FP32 consistently outperforms other models across all metrics (panels g-i).
3. **Architectural Impact:** Case iii (panel f) shows modified connectivity patterns compared to Case ii (panel e).
4. **Metric Divergence:** Panel i values differ significantly from g-h, suggesting different measurement criteria.
### Interpretation
The data demonstrates:
- **Performance Tradeoffs:** Higher accuracy (panel g) correlates with increased resource usage (panel i) in Mosaic SNN FP32.
- **Architectural Sensitivity:** Case iii's modified grid structure (panel f) may optimize specific metrics at the expense of others.
- **Temporal Dynamics:** CH1's 300ms spike (panel a) might represent critical processing events affecting overall network behavior.
- **Precision Impact:** FP32 implementation consistently improves performance across all models, with RRAM implementation reducing accuracy by ~15% in panel h.
The visualizations collectively suggest that neural network architecture and precision implementation significantly influence both performance metrics and temporal processing characteristics.